EMABands_v1
Download script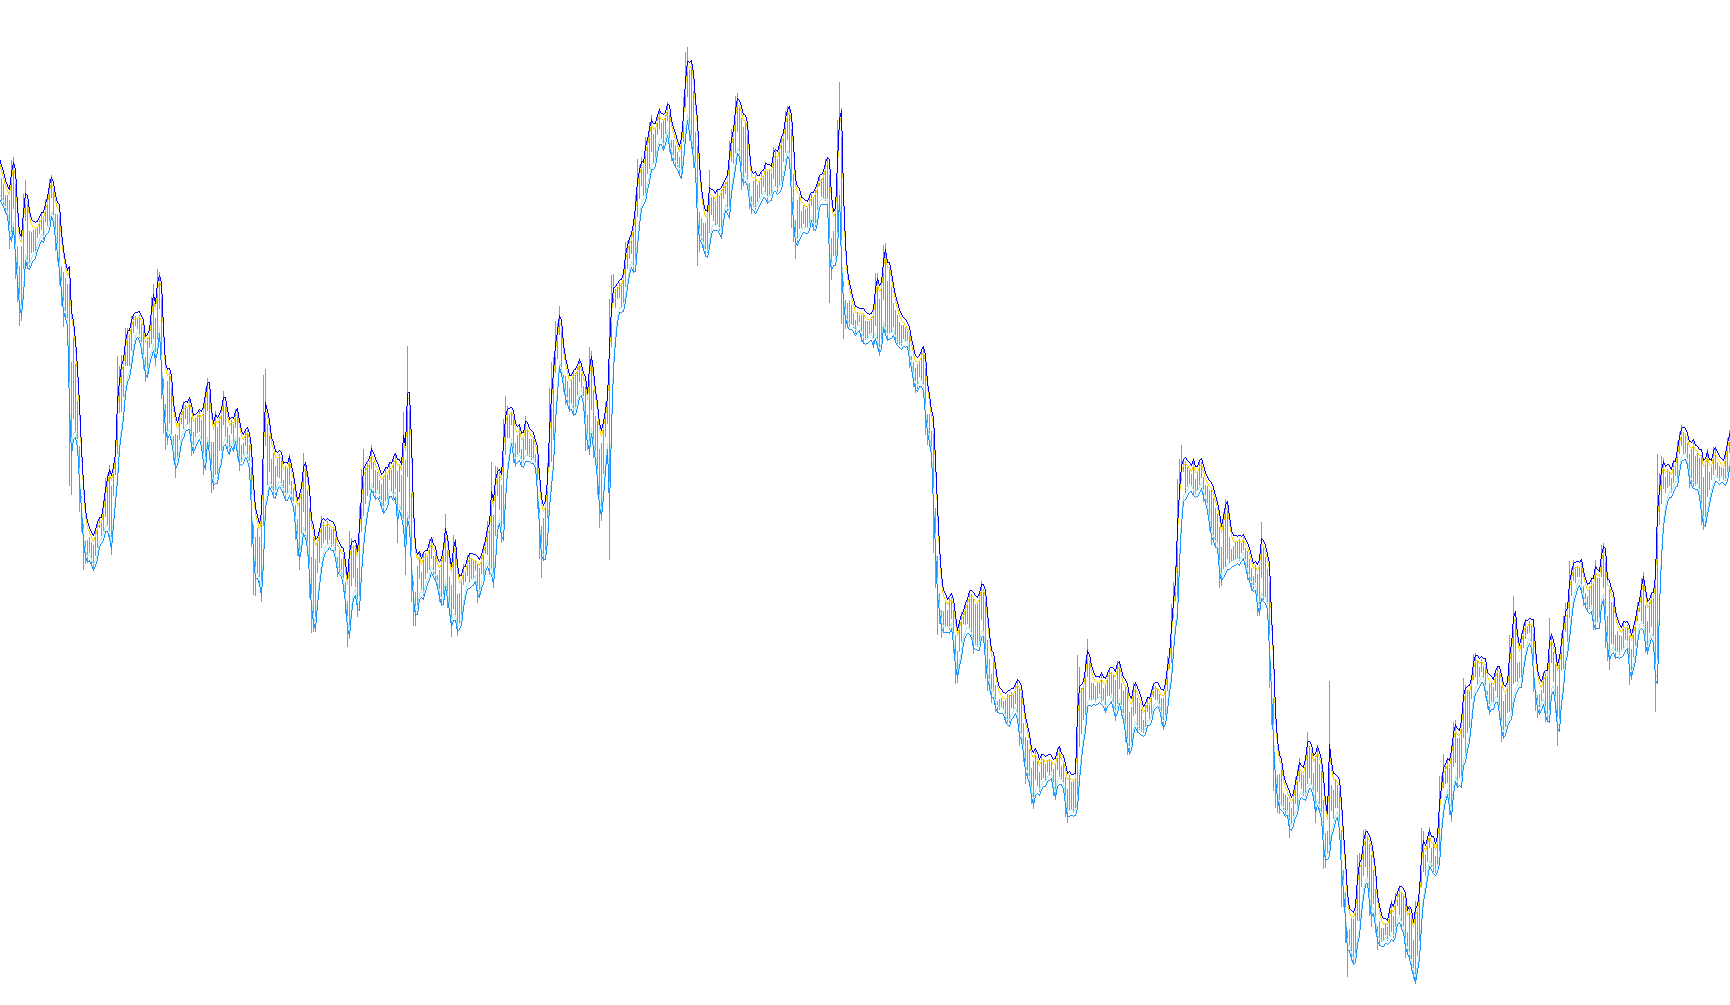
This technical tool, titled EMABands_v1, is designed to provide traders with a visual framework for identifying price boundaries and potential trend reversals on a trading chart. By utilizing moving averages as a foundation, it creates a structured "envelope" around the current market price.
Core Logic Overview
The script functions by calculating four distinct lines on your chart. These lines are derived from two primary price components: the highest price reached during a specific period (Highs) and the lowest price reached during that same period (Lows).
How the Calculations Work
The logic is divided into two main pairs of boundaries:
1. The Upper Boundaries (Resistance Indicators)
- Base Line: The tool first calculates a moving average based on the "High" prices of the market over a user-defined number of bars. This represents the ceiling of recent price action.
- Extended Band: It then projects a second line above this base by adding a specific numerical distance (Delta). This creates an outer boundary, helping traders see how far the price might stretch before encountering significant resistance.
2. The Lower Boundaries (Support Indicators)
- Base Line: Similarly, the tool calculates a moving average based on the "Low" prices of the market. This represents the floor of recent price action.
- Extended Band: It then projects a second line below this base by subtracting that same numerical distance (Delta). This creates an outer boundary for the bottom of the price range, identifying potential support levels.
Key Customization Factors
The behavior of the bands can be tailored through three main settings:
- Length: Determines how many previous candles are analyzed to calculate the averages. A shorter length makes the bands more reactive to sudden price movements, while a longer length makes them smoother and slower to change.
- MA_mode: Dictates the mathematical smoothing method used for the moving average (the "type" of average).
- Delta: Controls the width of the bands. This defines the gap between the primary moving average and the extended outer bands, allowing you to widen or tighten the "tunnel" the price moves within.
Summary of Purpose
In practical terms, this script creates a visual "channel" on your screen. When the price stays within these bands, it suggests a trending market; when the price approaches or breaks out of these bands, it serves as a signal for traders to monitor for potential exhaustion, reversals, or breakouts from the current price range.
//+------------------------------------------------------------------+
//|                                                  EMABands_v1.mq4 |
//|                                  Copyright © 2006, Forex-TSD.com |
//|                         Written by IgorAD,igorad2003@yahoo.co.uk |
//|            http://finance.groups.yahoo.com/group/TrendLaboratory |
//+------------------------------------------------------------------+
#property copyright "Copyright © 2006, Forex-TSD.com "
#property link      "http://www.forex-tsd.com/"

#property indicator_chart_window
#property indicator_buffers 4
#property indicator_color1 Blue
#property indicator_color2 Aqua
#property indicator_color3 Red
#property indicator_color4 Magenta

//---- input parameters
extern int Length=3;
extern int MA_mode=1;
extern int Delta=15;

//---- indicator buffers
double UpBuffer1[];
double UpBuffer2[];
double DnBuffer1[];
double DnBuffer2[];

//+------------------------------------------------------------------+
//| Custom indicator initialization function                         |
//+------------------------------------------------------------------+
  int init()
  {
   string short_name;
//---- indicator line
   SetIndexStyle(0,DRAW_LINE);
   SetIndexStyle(1,DRAW_LINE);
   SetIndexStyle(2,DRAW_LINE);
   SetIndexStyle(3,DRAW_LINE);

   SetIndexBuffer(0,UpBuffer1);
   SetIndexBuffer(1,UpBuffer2);
   SetIndexBuffer(2,DnBuffer1);
   SetIndexBuffer(3,DnBuffer2);
//---- name for DataWindow and indicator subwindow label
   short_name="EMABands("+Length+")";
   IndicatorShortName(short_name);
   SetIndexLabel(0,"Up1");
   SetIndexLabel(1,"Up2");
   SetIndexLabel(2,"Dn1");
   SetIndexLabel(3,"Dn2");
//----
   SetIndexDrawBegin(0,Length);
   SetIndexDrawBegin(1,Length);
   SetIndexDrawBegin(2,Length);
   SetIndexDrawBegin(3,Length);

//----
   return(0);
  }

//+------------------------------------------------------------------+
//| EMABands_v1                                                     |
//+------------------------------------------------------------------+
int start()
  {

   int shift,limit, counted_bars=IndicatorCounted();

   if ( counted_bars > 0 )  limit=Bars-counted_bars;
   if ( counted_bars < 0 )  return(0);
   if ( counted_bars ==0 )  limit=Bars-Length-1;

	for(shift=limit;shift>=0;shift--)
   {
   UpBuffer1[shift] = iMA(NULL,0,Length,0,MA_mode,PRICE_HIGH,shift);
   UpBuffer2[shift] = UpBuffer1[shift] + Delta*Point;
	DnBuffer1[shift] = iMA(NULL,0,Length,0,MA_mode,PRICE_LOW,shift);
   DnBuffer2[shift] = DnBuffer1[shift] - Delta*Point;
	}
	return(0);
 }
Comments