Heiken_Ashi_Ma_Bars2
Download script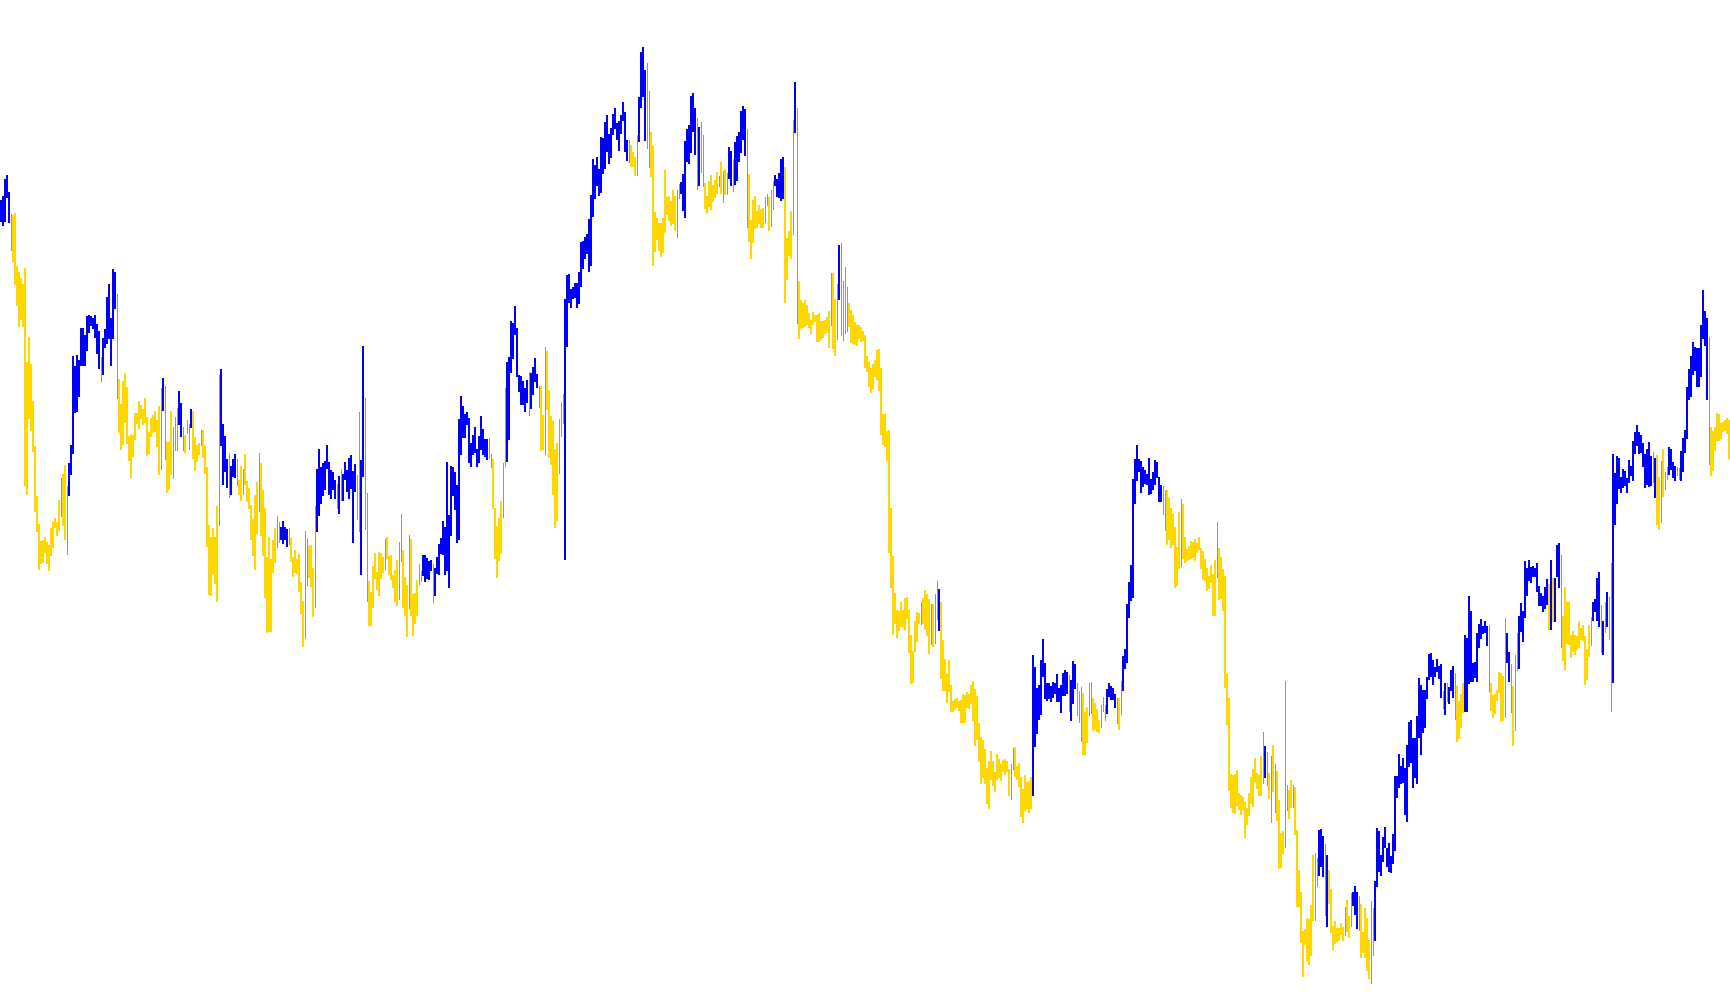
This tool is designed to provide traders with a smoother, more visual representation of market trends by combining two distinct types of price analysis: Moving Averages and Heiken Ashi calculations. Instead of looking at the raw, often "noisy" price data of every individual candle, this script filters the information to help identify the underlying direction of the market.
How the Logic Works
1. Data Smoothing (Moving Averages) The script begins by calculating standard Moving Averages based on a user-defined period and method. It looks at four specific points of price data: the opening price, the closing price, the highest point, and the lowest point. By using these averages rather than raw prices, the tool strips away minor market fluctuations that can often lead to false signals.
2. Heiken Ashi Synthesis The core logic then transforms these averaged values into a "Heiken Ashi" style calculation. This is a specialized method of charting where each candle's body and wicks are recalculated based on the average of previous prices.
- It determines a new "Open" and "Close" value by averaging previous data points.
- It identifies the "High" and "Low" by finding the extreme peaks and valleys between the current calculated price and the previous candle's data.
3. Trend Identification and Visualization The script uses these calculations to decide how to draw the visual indicators on your chart:
- Bullish Momentum: When the logic detects that the calculated "Close" is higher than the "Open," it interprets this as upward momentum. It then plots specific visual boundaries (highs and lows) to represent this strength.
- Bearish Momentum: Conversely, if the calculated "Close" is lower than the "Open," the script identifies downward pressure and adjusts the visual boundaries accordingly.
Summary of Behavior
In simple terms, the script acts as a filter. It takes the chaotic movement of live prices, runs them through a smoothing process (Moving Averages), converts them into a balanced visual format (Heiken Ashi), and then paints a histogram on your chart. This allows you to see the "flow" of the market—distinguishing between steady trends and temporary price spikes—making it easier to visualize whether the market is leaning toward a sustained move up or down.
//+------------------------------------------------------------------+
//|                                               Heiken Ashi Ma.mq4 |
//+------------------------------------------------------------------+
//|                                                      mod by Raff |
//+------------------------------------------------------------------+
#property copyright "Copyright © 2006, Forex-TSD.com "
#property link      "http://www.forex-tsd.com/"

#property indicator_chart_window
#property indicator_buffers 2
#property indicator_color1 Red
#property indicator_color2 RoyalBlue
//---- parameters
extern int MaMetod  = 1;
extern int MaPeriod = 13;

//---- buffers
double val1[];
double val2[];
double ExtMapBuffer1[];
double ExtMapBuffer2[];
double ExtMapBuffer3[];
double ExtMapBuffer4[];
//----
int ExtCountedBars=0;
//+------------------------------------------------------------------+
//| Custom indicator initialization function                         |
//|------------------------------------------------------------------|
int init()
  {
//---- indicators
   IndicatorBuffers(6);
   SetIndexStyle(0,DRAW_HISTOGRAM,0,3);
   SetIndexStyle(1,DRAW_HISTOGRAM,0,3);
   SetIndexBuffer(0,val1);
   SetIndexBuffer(1,val2);
//----
   SetIndexDrawBegin(0,5);
   SetIndexDrawBegin(1,5);
//---- indicator buffers mapping
   SetIndexBuffer(2,ExtMapBuffer1);
   SetIndexBuffer(3,ExtMapBuffer2);
   SetIndexBuffer(4,ExtMapBuffer3);
   SetIndexBuffer(5,ExtMapBuffer4);
//---- initialization done
   return(0);
  }
//+------------------------------------------------------------------+
//| Custor indicator deinitialization function                       |
//+------------------------------------------------------------------+
int deinit()
  {
//---- TODO: add your code here

//----
   return(0);
  }
//+------------------------------------------------------------------+
//| Custom indicator iteration function                              |
//+------------------------------------------------------------------+
int start()
  {
   double maOpen, maClose, maLow, maHigh;
   double haOpen, haHigh, haLow, haClose;
   if(Bars<=10) return(0);
   ExtCountedBars=IndicatorCounted();
//---- check for possible errors
   if (ExtCountedBars<0) return(-1);
//---- last counted bar will be recounted
   if (ExtCountedBars>0) ExtCountedBars--;
   int pos=Bars-ExtCountedBars-1;
   while(pos>=0)
     {
      maOpen=iMA(NULL,0,MaPeriod,0,MaMetod,MODE_OPEN,pos);
      maClose=iMA(NULL,0,MaPeriod,0,MaMetod,MODE_CLOSE,pos);
      maLow=iMA(NULL,0,MaPeriod,0,MaMetod,MODE_LOW,pos+1);
      maHigh=iMA(NULL,0,MaPeriod,0,MaMetod,MODE_HIGH,pos+1);

      haOpen=(ExtMapBuffer3[pos+1]+ExtMapBuffer4[pos+1])/2;
      haClose=(maOpen+maHigh+maLow+maClose)/4;
      haHigh=MathMax(maHigh, MathMax(haOpen, haClose));
      haLow=MathMin(maLow, MathMin(haOpen, haClose));
      if (haOpen<haClose)
        {
         ExtMapBuffer1[pos]=haLow;
         ExtMapBuffer2[pos]=haHigh;
        }
      else
        {
         ExtMapBuffer1[pos]=haHigh;
         ExtMapBuffer2[pos]=haLow;
        }
      ExtMapBuffer3[pos]=haOpen;
      ExtMapBuffer4[pos]=haClose;

	if (ExtMapBuffer3[pos]<ExtMapBuffer4[pos] && Close[pos]>ExtMapBuffer3[pos])
		{
		val1[pos]=Low[pos]; val2[pos]=High[pos];
		}
	if (ExtMapBuffer4[pos]<ExtMapBuffer3[pos] && Close[pos]<ExtMapBuffer4[pos])
		{
		val1[pos]=High[pos]; val2[pos]=Low[pos];
		}

 	   pos--;
     }
//----
   return(0);
  }
//+------------------------------------------------------------------+
Comments