(3) TEST_BARS_GBPJPY_8v1_Low_en
Download script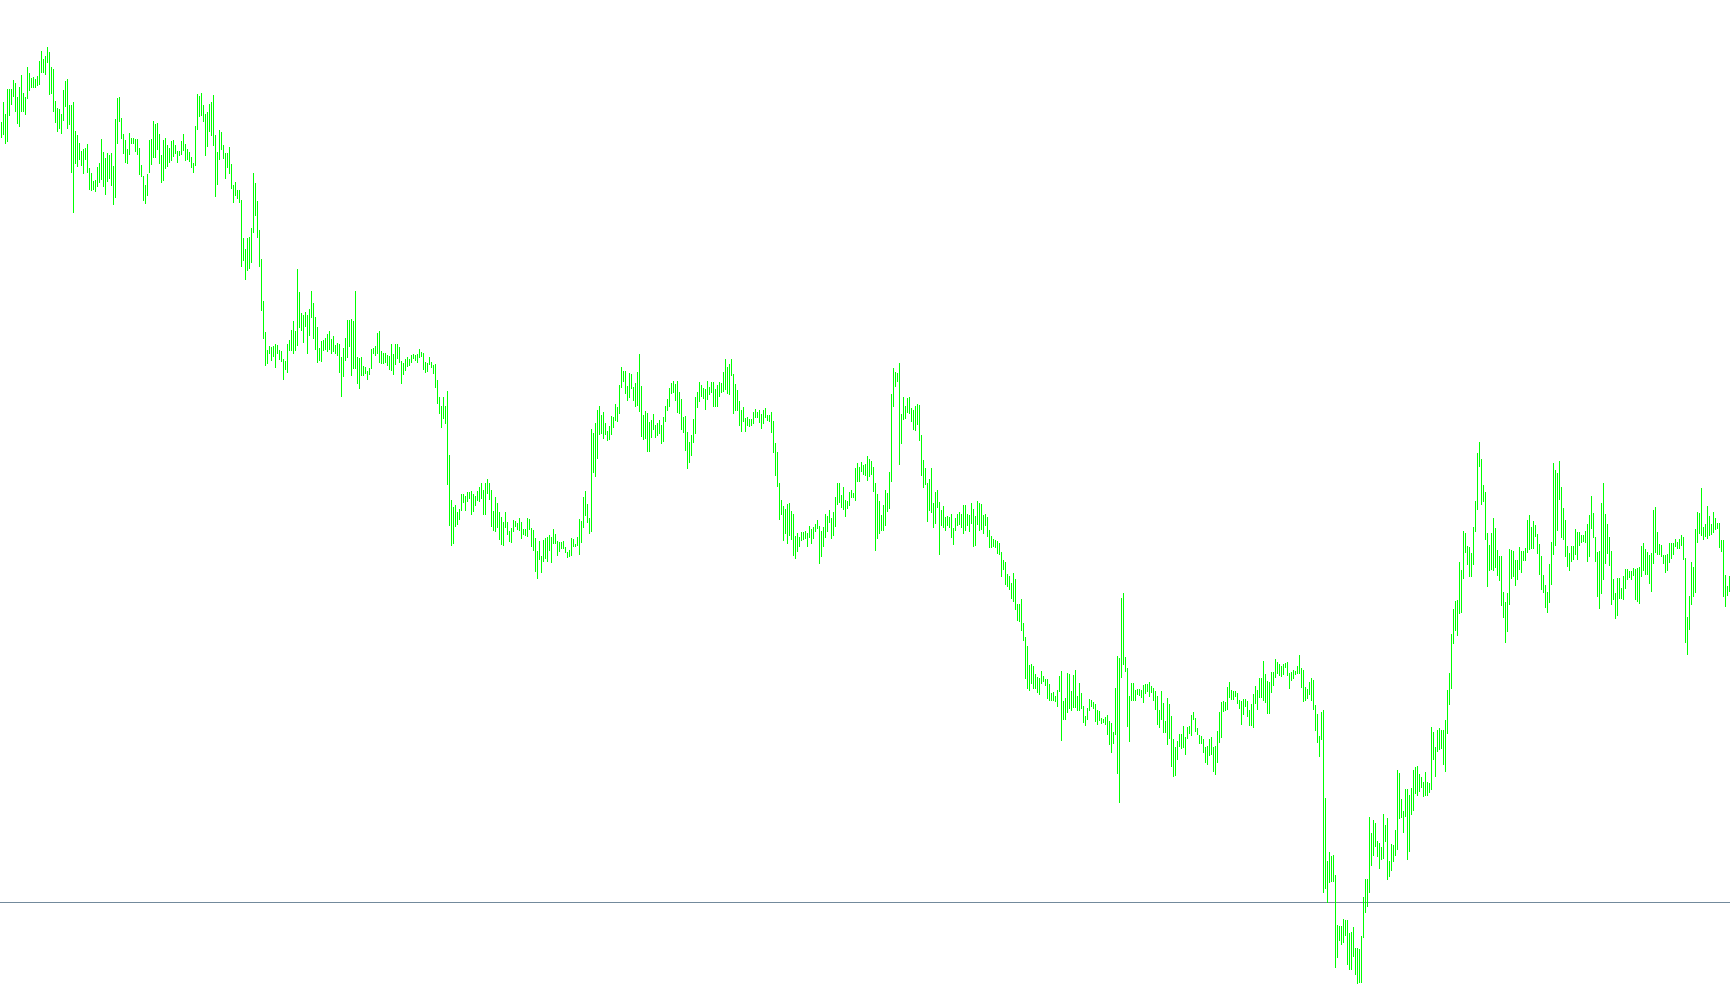
This script is designed as a specialized visual analysis tool for traders who want to compare the price movement of the GBPJPY currency pair against a composite average of two other pairs (GBPUSD and USDJPY) across four different technical indicators.
Instead of just showing you standard lines on a chart, this tool translates complex mathematical data into a visual "color-coded" map on the actual price candles. Here is how the logic works:
Core Concept: Comparison Logic
The script performs a "side-by-side" comparison. For every candle on your screen, it calculates four standard technical indicators for the GBPJPY pair:
- Momentum
- WPR (Williams %R)
- Stochastic Oscillator
- RSI (Relative Strength Index)
Simultaneously, it calculates a "synthetic" average for those same four indicators by combining the data from GBPUSD and USDJPY. It then compares the GBPJPY value against this combined average to determine which currency is showing more strength or weakness at that specific moment.
Visual Representation
To make this information easy to read at a glance, the script divides the lower half of each price candle into four horizontal sections (quarters). The tool changes the colors of these sections based on which indicator is "winning" the comparison:
- Momentum Comparison: Determines the coloring of the first two quarters of the lower half of the bar.
- WPR Comparison: Determines the coloring of the middle-lower section of the bar.
- Stochastic Comparison: Determines the coloring of the lower-middle section.
- RSI Comparison: Determines the coloring of the very bottom quarter of the bar.
How to Interpret the Results
The visual output uses a contrasting color scheme (Red and Blue).
- When the GBPJPY indicator value is higher than the average of the other two pairs, one section of the bar will be highlighted in one color.
- When the average of the other pairs is higher, the color switches to the opposite side of that specific section.
By looking at the bars, a trader can quickly see if GBPJPY is leading or lagging behind the broader market average across multiple metrics simultaneously. For example, if all sections are one color, it indicates a strong consensus across all four indicators; if the colors are mixed, it suggests a conflict or divergence in market sentiment.
//+------------------------------------------------------------------+
//| Ãîëóáûå ôèøêè                              TEST_BARS_GBPJPY_8v1_Low.mq4 |
//+------------------------------------------------------------------+
//| Íåîáõîäèìà ïðîâåðêà ðàáîòû â ðàçíûõ ÄÖ = âîçìîæíî ñèíòåòèêà ìîæåò èçìåíÿòñÿ !!!!!!!!!!!!!!!!!
//| Ýòîò èíäþê  ïðè ïîìîùè ðàñêðàñêè  ïîêàçûâàåò  ðàçíèöó â êàæäîé èç 4 (÷åòûðåõ)
//|   ÷àñòåé  ÍÈÆÍÅÉ ÏÎËÎÂÈÍÊÈ áàðà, ìåæäó ðàññ÷åòíûì è èñòèíûì ïîëîæåíèÿìè  êðîññà GBPJPY
//| èñïîëüçóþòñÿ 4 ñòàíäàðòíûõ èíäþêà ñ òåðìèíàëà = Momentum, WPR,RSI, Stochastic.
//|   Ïðè íàâåäåíèè ìûøêè í ëþáóþ èç ÷àñòåé áàðà, ïîëó÷èòå íåîáõîäèìóþ èíôîðìàöèþ !!!
//+------------------------------------------------------------------+
#property indicator_chart_window
#property indicator_buffers 8
#property indicator_color1 Red //Black
#property indicator_color2 Blue//Black White
#property indicator_color3 Red  //Blue
#property indicator_color4 Blue
#property indicator_color5 Red //Black
#property indicator_color6 Blue//Black White
#property indicator_color7 Red  //Blue
#property indicator_color8 Blue
//----
 extern int ilimit =  555;
 extern int Period_Momentum = 7;
 extern int Period_WPR  = 7;
 extern int Period_RSI  = 7;
 extern int Period_SToh = 7;
 extern int Slowing  = 3;
//---- buffers
 double val1[],val2[],val3[],val4[];
 double val11[],val22[],val33[],val44[];
//+------------------------------------------------------------------+
//| Custom indicator initialization function                         |
//+------------------------------------------------------------------+
 int init()
  {
   SetIndexStyle(0,DRAW_HISTOGRAM);
   SetIndexBuffer(0,val1);
   SetIndexDrawBegin(0,0);
   SetIndexStyle(1,DRAW_HISTOGRAM);
   SetIndexBuffer(1,val2);
   SetIndexDrawBegin(1,0);
   SetIndexStyle(2,DRAW_HISTOGRAM);
   SetIndexBuffer(2,val3);
   SetIndexDrawBegin(2,0);
   SetIndexStyle(3,DRAW_HISTOGRAM);
   SetIndexBuffer(3,val4);
   SetIndexDrawBegin(3,0);
    SetIndexLabel(0, "DIFFERENCE BETWEEN Momentum  GBPJPY            " );//ÐÀÇÍÈÖÀ ÌÅÆÄÓ Momentum  GBPJPY
    SetIndexLabel(2, "DIFFERENCE BETWEEN WPR GBPJPY           " );    //ÐÀÇÍÈÖÀ ÌÅÆÄÓ    WPR GBPJPY
       SetIndexStyle(4,DRAW_HISTOGRAM);
   SetIndexBuffer(4,val11);
   SetIndexDrawBegin(4,0);
   SetIndexStyle(5,DRAW_HISTOGRAM);
   SetIndexBuffer(5,val22);
   SetIndexDrawBegin(5,0);
   SetIndexStyle(6,DRAW_HISTOGRAM);
   SetIndexBuffer(6,val33);
   SetIndexDrawBegin(6,0);
   SetIndexStyle(7,DRAW_HISTOGRAM);
   SetIndexBuffer(7,val44);
   SetIndexDrawBegin(7,0);
    SetIndexLabel(4, "DIFFERENCE BETWEEN   SToh  GBPJPY            " );
    SetIndexLabel(6, "DIFFERENCE BETWEEN   RSI GBPJPY           " );
   return(0);
  }
//+------------------------------------------------------------------+
 int start()
  {
    { double r, rr, r1, rr1,r2, rr2, r3, rr3 ;
  int counted_bars = IndicatorCounted();
   if(counted_bars > 0)
       counted_bars--;
   int limit = Bars - counted_bars;
      limit = ilimit;
    for(int i = limit; i >= 0 ; i--)
	     {
   r=  iMomentum("GBPJPY", 0, Period_Momentum,PRICE_CLOSE, i);
	rr= iMomentum("GBPUSD", 0, Period_Momentum,PRICE_CLOSE, i)*0.5 + iMomentum("USDJPY", 0, Period_Momentum,PRICE_CLOSE,  i)*0.5;
 //+------------------------------------------------------------------+
   r1=  iWPR("GBPJPY", 0, Period_WPR, i);
	rr1= iWPR("GBPUSD", 0, Period_WPR, i)*0.5 + iWPR("USDJPY", 0, Period_WPR, i)*0.5;
//+------------------------------------------------------------------+
    r2= iStochastic("GBPJPY", 0, Period_SToh,3,Slowing, MODE_SMA, NULL, MODE_MAIN, i);  // EURJPY
	 rr2=iStochastic("GBPUSD",  0, Period_SToh,3,Slowing, MODE_SMA, NULL, MODE_MAIN, i)*0.5 +iStochastic("USDJPY",  0, Period_SToh,3,Slowing, MODE_SMA, NULL, MODE_MAIN, i)*0.5;
//+------------------------------------------------------------------+
    r3= iRSI("GBPJPY", 0, Period_RSI, PRICE_CLOSE,  i);
 	 rr3=iRSI("GBPUSD", 0, Period_RSI, PRICE_CLOSE,  i)*0.5 + iRSI("USDJPY", 0, Period_RSI , PRICE_CLOSE, i)*0.5;
 //+------------------------------
 if (r> rr)
 {
    val1[i]=  Low[i]+(High[i]-Low[i])*0.375;                  //âåðõíÿÿ ïåðâàÿ ÷åòâåðòü  íèæíåé ïîëîâèíêè áàðà
     val2[i]=Low[i]+(High[i]-Low[i])*0.5;
 }
if (rr>r)
 {
    val1[i]=   Low[i]+(High[i]-Low[i])*0.5;
     val2[i]=Low[i]+(High[i]-Low[i])*0.375;
  }
//+------------------------------
 if (r1>rr1&& r1> -50)
 {
   val3[i]=Low[i]+(High[i]-Low[i])*0.25;                     //âåðõíÿÿ âòîðàÿ ÷åòâåðòü  íèæíåé ïîëîâèíêè áàðà
    val4[i]=Low[i]+(High[i]-Low[i])*0.375;
 }
if (rr1>r1 && r1< -50)               //  Íàéòè ðåøåíèå = Ïðîâåðèòü  > èëè >= è  ìîæåò äîáàâèòü  r>=rr && r>=100 && rr>=100   ==???????????????
 {
    val3[i]=Low[i]+(High[i]-Low[i])*0.375;
    val4[i]=Low[i]+(High[i]-Low[i])*0.25;
 }
//+-----------------------------------
if (r2>rr2)
{
	val11[i]=Low[i]+(High[i]-Low[i])*0.125;
 val22[i]=Low[i]+(High[i]-Low[i])*0.25;                         //âåðõíÿÿ òðåòüÿ ÷åòâåðòü íèæíåé ïîëîâèíêè áàðà
}
if (rr2>r2)
{
     val11[i]=Low[i]+(High[i]-Low[i])*0.25;
      val22[i]=  Low[i]+(High[i]-Low[i])*0.125;
}
//+-----------------------------------
if (r3>rr3)
{
  val33[i]=Low[i];
  val44[i]= Low[i]+(High[i]-Low[i])*0.125;                        //ñàìàÿ íèæíÿÿ  ÷åòâåðòü íèæíåé ïîëîâèíêè áàðà
}
if (rr3>r3)
{
  val33[i]=Low[i]+(High[i]-Low[i])*0.125;
  val44[i]= Low[i];
 }
  }
   }
   return(0);
  }
//+------------------------------------------------------------------+
Comments