(3) TEST_BARS_GBPJPY_8v1_Low
Download script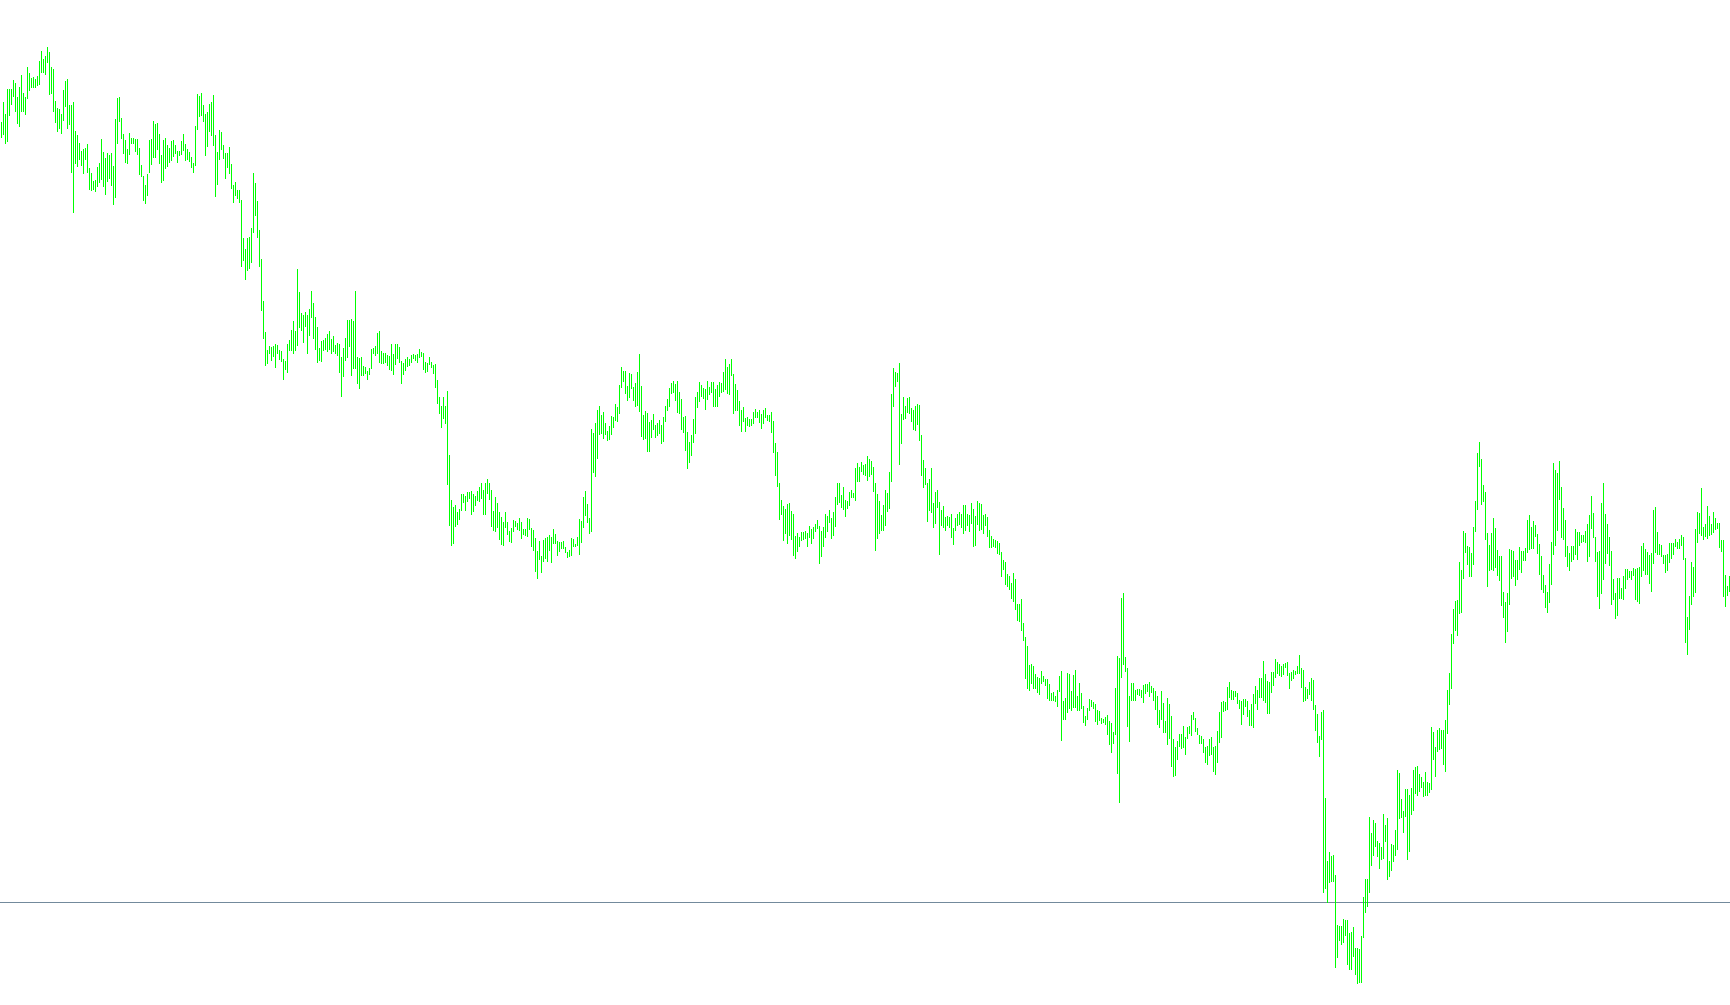
This script functions as a specialized visual analysis tool designed to monitor price action and momentum dynamics for the GBPJPY currency pair by comparing it against an average of other related pairs. Its primary goal is to identify shifts in market "weight" or pressure by analyzing four different technical indicators simultaneously.
Core Logic Overview
The indicator operates by calculating data points for two distinct categories:
- Primary Signal: Data derived directly from the GBPJPY pair.
- Comparative Benchmark: A synthetic average calculated by combining the data of GBPUSD and USDJPY (each weighted at 50%).
By comparing these two sets of data, the script determines which "force" is stronger at any given moment across four different mathematical perspectives.
Technical Indicators Used
The logic evaluates the following four standard indicators to provide a comprehensive view:
- Momentum: Measures the speed of price movements.
- WPR (Williams %R): Identifies overbought or oversold conditions.
- Stochastic Oscillator: Tracks the relative position of prices within a specific range.
- RSI (Relative Strength Index): Measures the speed and change of price movements to identify momentum.
Visual Execution & Data Representation
Instead of showing standard lines or curves, the script translates these mathematical comparisons into a visual "color-coding" system directly on the price candles.
The logic divides the lower half of each price bar into four distinct sections (quarters). Depending on which side of the comparison is "winning" (the primary pair vs. the benchmark average), the script assigns specific heights to colored histograms:
- Momentum Comparison: Determines the distribution of the first two segments of the lower half of the bar.
- WPR Comparison: Handles the middle sections, including a specific logic check for overbought/oversold thresholds.
- Stochastic Comparison: Controls the height of the third quarter of the lower half.
- RSI Comparison: Determines the height of the very bottom-most section of the bar.
Summary for the User
When you view the chart, the visual output tells you at a glance which market force is dominating. If the primary GBPJPY signals are stronger than the combined benchmark, the "weight" of the histogram will shift in one direction; if the benchmark average is stronger, the weight shifts the other way. This allows a trader to see complex multi-pair momentum analysis as a simple, color-coded visual representation on a single chart.
//+------------------------------------------------------------------+
//| Ãîëóáûå ôèøêè                              TEST_BARS_GBPJPY_8v1_Low.mq4 |
 //+------------------------------------------------------------------+
//| Íåîáõîäèìà ïðîâåðêà ðàáîòû â ðàçíûõ ÄÖ = âîçìîæíî ñèíòåòèêà ìîæåò èçìåíÿòñÿ !!!!!!!!!!!!!!!!!
//| Ýòîò èíäþê  ïðè ïîìîùè ðàñêðàñêè  ïîêàçûâàåò  ðàçíèöó â êàæäîé èç 4 (÷åòûðåõ)
//|   ÷àñòåé  ÍÈÆÍÅÉ ÏÎËÎÂÈÍÊÈ áàðà, ìåæäó ðàññ÷åòíûì è èñòèíûì ïîëîæåíèÿìè  êðîññà GBPJPY
//| èñïîëüçóþòñÿ 4 ñòàíäàðòíûõ èíäþêà ñ òåðìèíàëà = Momentum, WPR,RSI, Stochastic.
//|   Ïðè íàâåäåíèè ìûøêè í ëþáóþ èç ÷àñòåé áàðà, ïîëó÷èòå íåîáõîäèìóþ èíôîðìàöèþ !!!
//+------------------------------------------------------------------+
#property indicator_chart_window
#property indicator_buffers 8
#property indicator_color1 Red //Black
#property indicator_color2 Blue//Black White
#property indicator_color3 Red  //Blue
#property indicator_color4 Blue
#property indicator_color5 Red //Black
#property indicator_color6 Blue//Black White
#property indicator_color7 Red  //Blue
#property indicator_color8 Blue
//----
 extern int ilimit =  555;
 extern int Period_Momentum = 7;
 extern int Period_WPR  = 7;
 extern int Period_RSI  = 7;
 extern int Period_SToh = 7;
 extern int Slowing  = 3;
//---- buffers
 double val1[],val2[],val3[],val4[];
 double val11[],val22[],val33[],val44[];
//+------------------------------------------------------------------+
//| Custom indicator initialization function                         |
//+------------------------------------------------------------------+
 int init()
  {
   SetIndexStyle(0,DRAW_HISTOGRAM);
   SetIndexBuffer(0,val1);
   SetIndexDrawBegin(0,0);
   SetIndexStyle(1,DRAW_HISTOGRAM);
   SetIndexBuffer(1,val2);
   SetIndexDrawBegin(1,0);
   SetIndexStyle(2,DRAW_HISTOGRAM);
   SetIndexBuffer(2,val3);
   SetIndexDrawBegin(2,0);
   SetIndexStyle(3,DRAW_HISTOGRAM);
   SetIndexBuffer(3,val4);
   SetIndexDrawBegin(3,0);
    SetIndexLabel(0, "ÐÀÇÍÈÖÀ ÌÅÆÄÓ Momentum  GBPJPY            " );
    SetIndexLabel(2, "ÐÀÇÍÈÖÀ ÌÅÆÄÓ    WPR GBPJPY           " );
       SetIndexStyle(4,DRAW_HISTOGRAM);
   SetIndexBuffer(4,val11);
   SetIndexDrawBegin(4,0);
   SetIndexStyle(5,DRAW_HISTOGRAM);
   SetIndexBuffer(5,val22);
   SetIndexDrawBegin(5,0);
   SetIndexStyle(6,DRAW_HISTOGRAM);
   SetIndexBuffer(6,val33);
   SetIndexDrawBegin(6,0);
   SetIndexStyle(7,DRAW_HISTOGRAM);
   SetIndexBuffer(7,val44);
   SetIndexDrawBegin(7,0);
    SetIndexLabel(4, "ÐÀÇÍÈÖÀ ÌÅÆÄÓ   SToh  GBPJPY            " );
    SetIndexLabel(6, "ÐÀÇÍÈÖÀ ÌÅÆÄÓ    RSI GBPJPY           " );
   return(0);
  }
//+------------------------------------------------------------------+
 int start()
  {
    { double r, rr, r1, rr1,r2, rr2, r3, rr3 ;
  int counted_bars = IndicatorCounted();
   if(counted_bars > 0)
       counted_bars--;
   int limit = Bars - counted_bars;
      limit = ilimit;
    for(int i = limit; i >= 0 ; i--)
	     {
   r=  iMomentum("GBPJPY", 0, Period_Momentum,PRICE_CLOSE, i);
	rr= iMomentum("GBPUSD", 0, Period_Momentum,PRICE_CLOSE, i)*0.5 + iMomentum("USDJPY", 0, Period_Momentum,PRICE_CLOSE,  i)*0.5;
 //+------------------------------------------------------------------+
   r1=  iWPR("GBPJPY", 0, Period_WPR, i);
	rr1= iWPR("GBPUSD", 0, Period_WPR, i)*0.5 + iWPR("USDJPY", 0, Period_WPR, i)*0.5;
//+------------------------------------------------------------------+
    r2= iStochastic("GBPJPY", 0, Period_SToh,3,Slowing, MODE_SMA, NULL, MODE_MAIN, i);  // EURJPY
	 rr2=iStochastic("GBPUSD",  0, Period_SToh,3,Slowing, MODE_SMA, NULL, MODE_MAIN, i)*0.5 +iStochastic("USDJPY",  0, Period_SToh,3,Slowing, MODE_SMA, NULL, MODE_MAIN, i)*0.5;
//+------------------------------------------------------------------+
    r3= iRSI("GBPJPY", 0, Period_RSI, PRICE_CLOSE,  i);
 	 rr3=iRSI("GBPUSD", 0, Period_RSI, PRICE_CLOSE,  i)*0.5 + iRSI("USDJPY", 0, Period_RSI , PRICE_CLOSE, i)*0.5;
 //+------------------------------
 if (r> rr)
 {
    val1[i]=  Low[i]+(High[i]-Low[i])*0.375;                  //âåðõíÿÿ ïåðâàÿ ÷åòâåðòü  íèæíåé ïîëîâèíêè áàðà
     val2[i]=Low[i]+(High[i]-Low[i])*0.5;
 }
if (rr>r)
 {
    val1[i]=   Low[i]+(High[i]-Low[i])*0.5;
     val2[i]=Low[i]+(High[i]-Low[i])*0.375;
  }
//+------------------------------
 if (r1>rr1&& r1> -50)
 {
   val3[i]=Low[i]+(High[i]-Low[i])*0.25;                     //âåðõíÿÿ âòîðàÿ ÷åòâåðòü  íèæíåé ïîëîâèíêè áàðà
    val4[i]=Low[i]+(High[i]-Low[i])*0.375;
 }
if (rr1>r1 && r1< -50)               //  Íàéòè ðåøåíèå = Ïðîâåðèòü  > èëè >= è  ìîæåò äîáàâèòü  r>=rr && r>=100 && rr>=100   ==???????????????
 {
    val3[i]=Low[i]+(High[i]-Low[i])*0.375;
    val4[i]=Low[i]+(High[i]-Low[i])*0.25;
 }
//+-----------------------------------
if (r2>rr2)
{
	val11[i]=Low[i]+(High[i]-Low[i])*0.125;
 val22[i]=Low[i]+(High[i]-Low[i])*0.25;                         //âåðõíÿÿ òðåòüÿ ÷åòâåðòü íèæíåé ïîëîâèíêè áàðà
}
if (rr2>r2)
{
     val11[i]=Low[i]+(High[i]-Low[i])*0.25;
      val22[i]=  Low[i]+(High[i]-Low[i])*0.125;
}
//+-----------------------------------
if (r3>rr3)
{
  val33[i]=Low[i];
  val44[i]= Low[i]+(High[i]-Low[i])*0.125;                        //ñàìàÿ íèæíÿÿ  ÷åòâåðòü íèæíåé ïîëîâèíêè áàðà
}
if (rr3>r3)
{
  val33[i]=Low[i]+(High[i]-Low[i])*0.125;
  val44[i]= Low[i];
 }
  }
   }
   return(0);
  }
//+------------------------------------------------------------------+
Comments