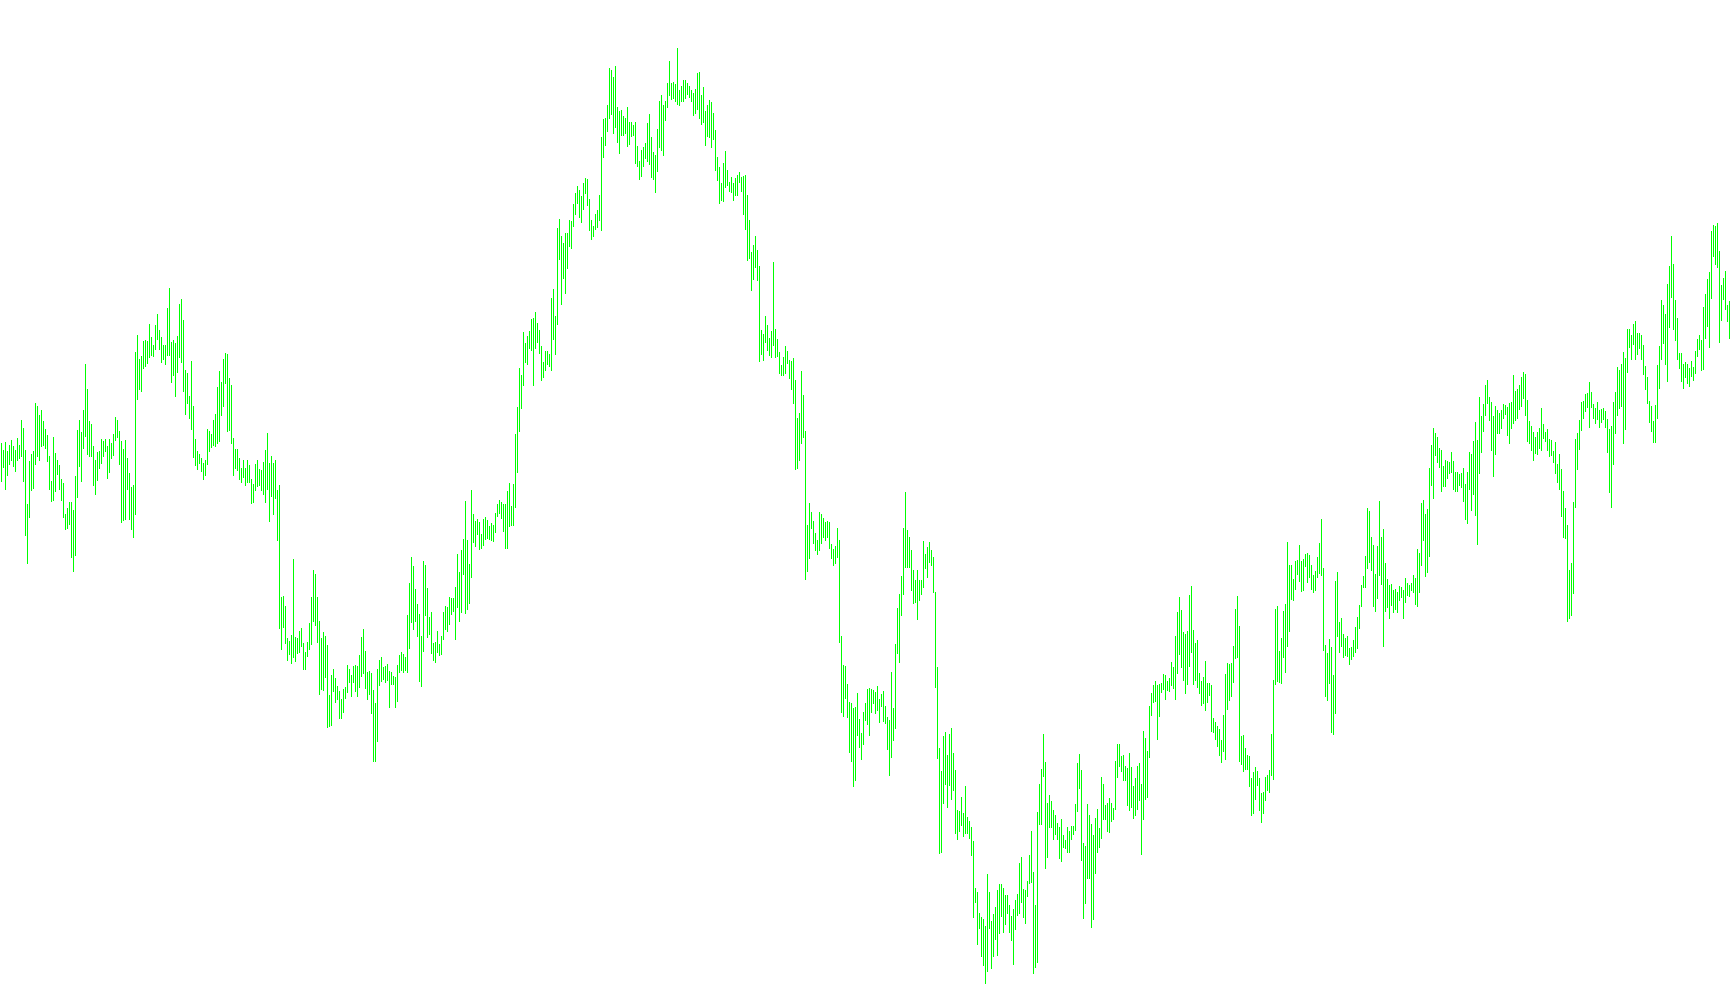
This technical indicator is designed to help traders identify extreme price movements by measuring how far the current market price deviates from its historical average. Instead of simply looking at the raw price, it uses a statistical method to determine if the asset is currently "overextended" or "over-correcting."
How the Logic Works
The tool operates by analyzing a specific window of recent price data (defined by the user as up to 2,000 bars) and performing three main steps for every point on the chart:
- Identifying the Baseline: The script calculates a Moving Average based on the last 60 periods. This serves as the "norm" or the expected equilibrium price for the asset.
- Measuring the Gap: It then calculates the distance between the current closing price and that 60-period average. This tells us how much the price has moved away from its recent trend.
- Normalizing the Volatility (The Z-Score): To make this data useful, the script doesn't just look at the raw gap; it divides that gap by the standard deviation (the historical volatility) of the same period.
What This Means for the Trader
By converting price movement into a "Z-Score," the indicator translates complex market noise into a standardized value.
- When the value is near zero: The market price is trading very close to its average, suggesting a stable trend or a point of equilibrium.
- When the value moves significantly away from zero: It indicates that the price is moving at an unusual speed relative to its normal volatility. High positive values suggest the price is stretched significantly above its average, while high negative values suggest it has dropped significantly below it.
Ultimately, this script allows you to see "statistical extremes" in a separate window, helping you identify potential exhaustion points where the market might be due for a reversal or a period of consolidation.
//+------------------------------------------------------------------+
//|                                                       zscore.mq4 |
//|                                                        modulatum |
//+------------------------------------------------------------------+
#property copyright "Mod"

#property indicator_separate_window
#property indicator_buffers 1
#property indicator_color1 DeepSkyBlue
#property indicator_level1 0
//---- input parameters
extern int       barsToCount = 2000;
//---- buffers
double zscore[];

//+------------------------------------------------------------------+
//| Custom indicator initialization function                         |
//+------------------------------------------------------------------+
int init()
  {
//---- indicators
   IndicatorBuffers(1);
   SetIndexStyle(0,DRAW_LINE);
   SetIndexBuffer(0,zscore);
//----
   return(0);
  }
//+------------------------------------------------------------------+
//| Custom indicator deinitialization function                       |
//+------------------------------------------------------------------+
int deinit()
  {
//----

//----
   return(0);
  }
//+------------------------------------------------------------------+
//| Custom indicator iteration function                              |
//+------------------------------------------------------------------+
int start()
  {
   int limit = barsToCount;

//----

   for(int i = 0 ;i <= limit-20 ;i++)
   {

      zscore[i] = (iClose(NULL,0,i)-iMA(NULL,0,60,0,0,0,i))/iStdDev(NULL,0,60,0,0,0,i);
   }
//----
   return(0);
  }
//+------------------------------------------------------------------+
Comments