Critical Points
Download script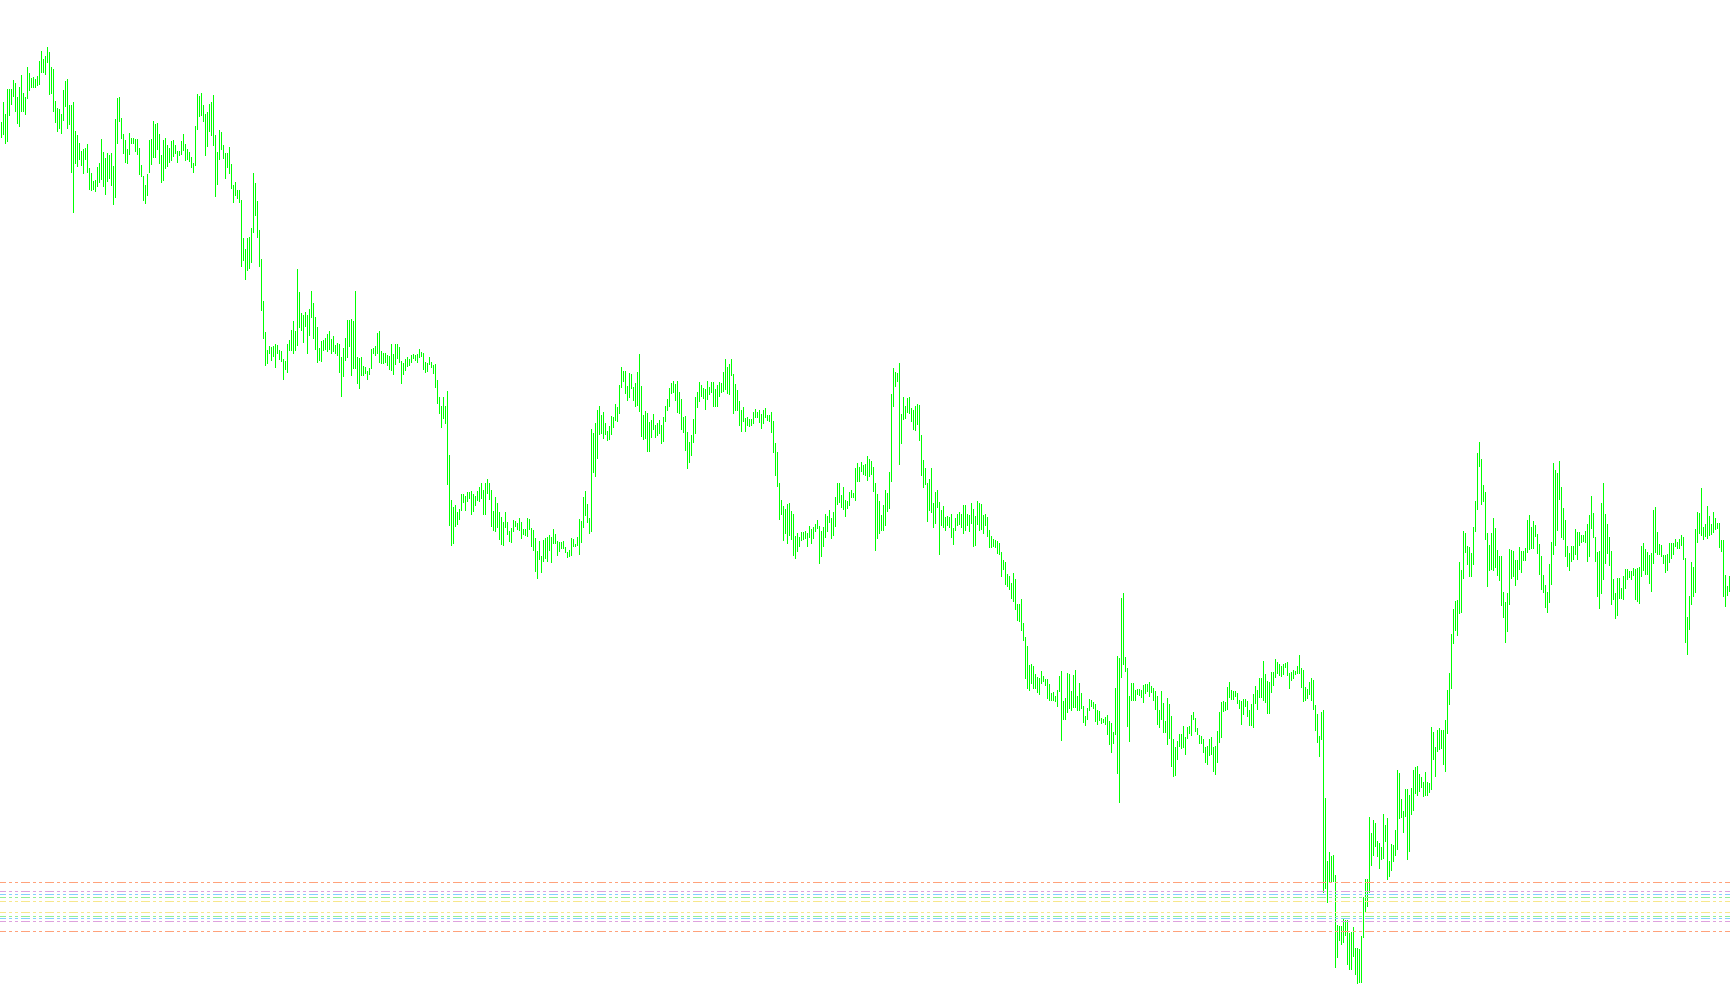
The Critical Points script is a technical analysis tool designed to provide traders with visual cues regarding potential support and resistance levels on a trading chart. By combining two fundamental methods of market analysis—Moving Averages and Fibonacci-inspired offsets—the script identifies dynamic zones where price action may encounter significant friction or momentum shifts.
Core Logic and Functionality
The script operates by identifying a central "anchor" price and then projecting a series of specific boundaries above and below that point. Here is a breakdown of how this logic flows:
1. Establishing the Baseline The foundation of the indicator is a Simple Moving Average (SMA). This serves as the primary reference point for the current market trend. By calculating the average price over a specific period, the script determines the "fair value" of the asset at any given moment.
2. Dynamic Zone Projection Instead of showing just a single moving line, the script calculates five distinct levels above and five distinct levels below that baseline. These levels are determined by applying mathematical offsets (based on Fibonacci proportions) to the moving average.
- Upper Boundaries: These represent potential resistance zones where upward momentum might slow down or face selling pressure.
- Lower Boundaries: These represent potential support zones where downward momentum might stabilize or face buying interest.
3. Visual Execution The script automatically renders these ten levels as horizontal dashed lines on your chart. To ensure the data remains relevant to current market conditions:
- Real-Time Updates: As the moving average shifts with new price data, the script automatically recalculates and moves all ten lines simultaneously.
- Color Coding: Each pair of levels (the upper and lower bounds) is assigned a specific color. This helps traders quickly distinguish between different "tiers" of volatility—for example, closer lines may represent immediate price targets, while outer lines may represent broader structural boundaries.
Practical Application for Traders
For a non-technical user, this tool functions as a dynamic "map" of the market. Rather than looking at static historical data, you are viewing a set of shifting zones that move with the trend. By observing where the price interacts with these colored dashed lines, traders can better identify:
- Breakout Opportunities: When the price pushes decisively through multiple levels.
- Rejection Zones: When the price touches a line and reverses direction.
- Consolidation Areas: When the price remains "trapped" between specific upper and lower boundaries.
//+------------------------------------------------------------------+
//|                                              Critical Points.mq4 |
//|                                                         emsjoflo |
//|                                  automaticforex.invisionzone.com |
//+------------------------------------------------------------------+
#property copyright "emsjoflo"
#property link      "automaticforex.invisionzone.com"

#property indicator_chart_window
#property indicator_buffers 1
#property indicator_color1 Red
//---- input parameters
extern int       SMAPeriod=157;
extern int       Fib1=23;
extern int       Fib2=38;
extern int       Fib3=50;
extern int       Fib4=61;
extern int       Fib5=100;
extern color     Color1=Khaki;
extern color     Color2=LightGreen;
extern color     Color3=LightSkyBlue;
extern color     Color4=Plum;
extern color     Color5=LightSalmon;
double Line1,Line_1,Line2,Line_2,Line3,Line_3,Line4,Line_4,Line5,Line_5,MAVal,MAValOld;

//---- buffers
double ExtMapBuffer1[];
//+------------------------------------------------------------------+
//| Custom indicator initialization function                         |
//+------------------------------------------------------------------+
int init()
  {
//---- indicators
   SetIndexStyle(0,DRAW_LINE);
   SetIndexBuffer(0,ExtMapBuffer1);
//----
   return(0);
  }
//+------------------------------------------------------------------+
//| Custom indicator deinitialization function                       |
//+------------------------------------------------------------------+
int deinit()
  {
//----
ObjectDelete("cp1");
ObjectDelete("cp2");
ObjectDelete("cp3");
ObjectDelete("cp4");
ObjectDelete("cp5");
ObjectDelete("cp_1");
ObjectDelete("cp_2");
ObjectDelete("cp_3");
ObjectDelete("cp_4");
ObjectDelete("cp_5");


//----
   return(0);
  }
//+------------------------------------------------------------------+
//| Custom indicator iteration function                              |
//+------------------------------------------------------------------+
int start()
  {
   int    counted_bars=IndicatorCounted();
//----

   MAVal=iMA(NULL,0,SMAPeriod,0,MODE_SMA,0,1);
   Line1=MAVal+Fib1*Point;
   Line2=MAVal+Fib2*Point;
   Line3=MAVal+Fib3*Point;
   Line4=MAVal+Fib4*Point;
   Line5=MAVal+Fib5*Point;
   Line_1=MAVal-Fib1*Point;
   Line_2=MAVal-Fib2*Point;
   Line_3=MAVal-Fib3*Point;
   Line_4=MAVal-Fib4*Point;
   Line_5=MAVal-Fib5*Point;

   if(ObjectFind("cp1") != 0)
      {
      ObjectCreate("cp1", OBJ_HLINE, 0, Time[20], Line1);
      ObjectSet("cp1", OBJPROP_STYLE, STYLE_DASHDOTDOT);
      ObjectSet("cp1", OBJPROP_COLOR, Color1);
      }
      else
      {
      ObjectMove("cp1", 0, Time[20], Line1);
      }

   if(ObjectFind("cp2") != 0)
      {
      ObjectCreate("cp2", OBJ_HLINE, 0, Time[20], Line2);
      ObjectSet("cp2", OBJPROP_STYLE, STYLE_DASHDOTDOT);
      ObjectSet("cp2", OBJPROP_COLOR, Color2);
      }
      else
      {
      ObjectMove("cp2", 0, Time[20], Line2);
      }

    if(ObjectFind("cp3") != 0)
      {
      ObjectCreate("cp3", OBJ_HLINE, 0, Time[20], Line3);
      ObjectSet("cp3", OBJPROP_STYLE, STYLE_DASHDOTDOT);
      ObjectSet("cp3", OBJPROP_COLOR, Color3);
      }
      else
      {
      ObjectMove("cp3", 0, Time[20], Line3);
      }

   if(ObjectFind("cp4") != 0)
      {
      ObjectCreate("cp4", OBJ_HLINE, 0, Time[20], Line4);
      ObjectSet("cp4", OBJPROP_STYLE, STYLE_DASHDOTDOT);
      ObjectSet("cp4", OBJPROP_COLOR, Color4);
      }
      else
      {
      ObjectMove("cp4", 0, Time[20], Line4);
      }


   if(ObjectFind("cp5") != 0)
      {
      ObjectCreate("cp5", OBJ_HLINE, 0, Time[20], Line5);
      ObjectSet("cp5", OBJPROP_STYLE, STYLE_DASHDOTDOT);
      ObjectSet("cp5", OBJPROP_COLOR, Color5);
      }
      else
      {
      ObjectMove("cp5", 0, Time[20], Line5);
      }

  if(ObjectFind("cp_1") != 0)
      {
      ObjectCreate("cp_1", OBJ_HLINE, 0, Time[20], Line_1);
      ObjectSet("cp_1", OBJPROP_STYLE, STYLE_DASHDOTDOT);
      ObjectSet("cp_1", OBJPROP_COLOR, Color1);
      }
      else
      {
      ObjectMove("cp_1", 0, Time[20], Line_1);
      }

   if(ObjectFind("cp_2") != 0)
      {
      ObjectCreate("cp_2", OBJ_HLINE, 0, Time[20], Line_2);
      ObjectSet("cp_2", OBJPROP_STYLE, STYLE_DASHDOTDOT);
      ObjectSet("cp_2", OBJPROP_COLOR, Color2);
      }
      else
      {
      ObjectMove("cp_2", 0, Time[20], Line_2);
      }

    if(ObjectFind("cp_3") != 0)
      {
      ObjectCreate("cp_3", OBJ_HLINE, 0, Time[20], Line_3);
      ObjectSet("cp_3", OBJPROP_STYLE, STYLE_DASHDOTDOT);
      ObjectSet("cp_3", OBJPROP_COLOR, Color3);
      }
      else ObjectMove("cp_3", 0, Time[20], Line_3);


   if(ObjectFind("cp_4") != 0)
      {
      ObjectCreate("cp_4", OBJ_HLINE, 0, Time[20], Line_4);
      ObjectSet("cp_4", OBJPROP_STYLE, STYLE_DASHDOTDOT);
      ObjectSet("cp_4", OBJPROP_COLOR, Color4);
      }
      else ObjectMove("cp_4", 0, Time[20], Line_4);


   if(ObjectFind("cp_5") != 0)
      {
      ObjectCreate("cp_5", OBJ_HLINE, 0, Time[20], Line_5);
      ObjectSet("cp_5", OBJPROP_STYLE, STYLE_DASHDOTDOT);
      ObjectSet("cp_5", OBJPROP_COLOR, Color5);
      }
      else
      {
      ObjectMove("cp_5", 0, Time[20], Line_5);
      }


//----
   return(0);
  }

//+------------------------------------------------------------------+
Comments