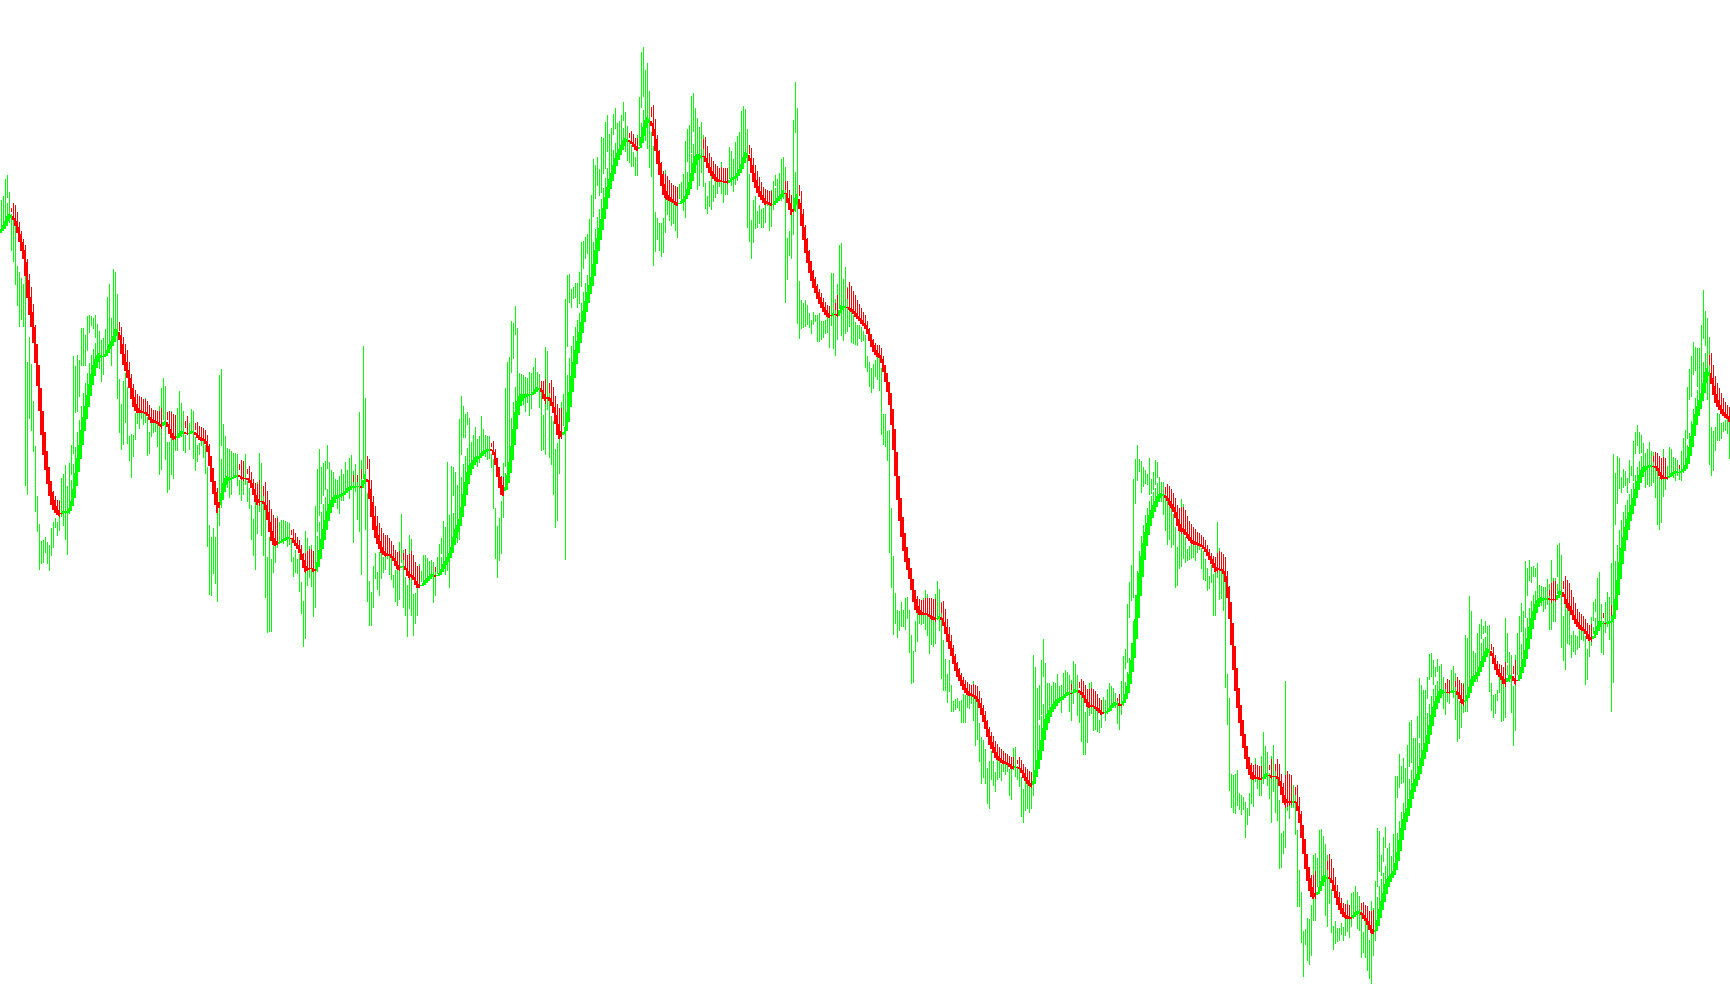
Overview of the Heiken Ashi Smoothed Indicator
This script is designed to transform the way market price action is visualized on a trading chart. It takes standard candlestick data—which can often appear "noisy" or erratic due to minor price fluctuations—and converts it into a smoothed, trend-oriented format inspired by Heiken Ashi charting techniques.
By simplifying the visual representation of price movements, the tool helps traders identify the underlying direction of the market more clearly.
How the Logic Works
The indicator functions through a multi-stage calculation process to clean up price data and highlight trends:
1. Data Smoothing (Moving Averages) Instead of looking at the raw high, low, open, and close prices of every individual candle, the script first calculates Moving Averages for these four values. This acts as the first layer of "filtering," removing minor market jitters and focusing on the broader price flow.
2. Heiken Ashi Conversion Once the price data is smoothed, the script applies a specific mathematical formula to create "synthetic" candles:
- Opening Price: It calculates a new opening value based on the previous candle's average.
- Closing Price: It determines a new closing value by averaging the smoothed high, low, open, and close prices.
- High and Low Points: It identifies the highest and lowest points of the price action, ensuring they are consistent with the newly calculated open and close values.
3. Secondary Smoothing To ensure the final visual output is as fluid as possible, the script performs a second round of smoothing on the newly created Heiken Ashi values. This final step rounds off any sharp edges in the data, resulting in a "Smoothed" effect.
Visual Representation
The final result is displayed as a series of colored histograms on your chart:
- Trend Identification: The colors (Red and Lime) shift based on whether the synthetic "close" is higher or lower than the "open."
- Trend Strength: Because the data is smoothed twice, the indicator helps highlight sustained movements. When the color remains consistent over several bars, it suggests a stronger trend; when colors flip, it indicates a potential shift in market momentum.
Summary for the User
In short, this script takes raw, messy market data and runs it through two different "filters." First, it averages the price to remove noise, and second, it converts that data into a smoothed trend line. This allows you to see whether the market is moving up or down with much less visual distraction than a standard candlestick chart.
//+------------------------------------------------------------------+
//|                                         Heiken Ashi Smoothed.mq4 |
//+------------------------------------------------------------------+
//|                                                      mod by Raff |
//+------------------------------------------------------------------+
#property copyright "Copyright © 2006, Forex-TSD.com "
#property link      "http://www.forex-tsd.com/"

#property indicator_chart_window
#property indicator_buffers 4
#property indicator_color1 Red
#property indicator_color2 Lime
#property indicator_color3 Red
#property indicator_color4 Lime
//---- parameters
extern int MaMetod  = 2;
extern int MaPeriod = 6;
extern int MaMetod2  = 3;
extern int MaPeriod2 = 2;
//---- buffers
double ExtMapBuffer1[];
double ExtMapBuffer2[];
double ExtMapBuffer3[];
double ExtMapBuffer4[];
double ExtMapBuffer5[];
double ExtMapBuffer6[];
double ExtMapBuffer7[];
double ExtMapBuffer8[];
//----
int ExtCountedBars=0;
//+------------------------------------------------------------------+
//| Custom indicator initialization function                         |
//|------------------------------------------------------------------|
int init()
  {
//---- indicators
   IndicatorBuffers(8);

   SetIndexStyle(0,DRAW_HISTOGRAM, 0, 1, Red);
   SetIndexBuffer(0, ExtMapBuffer1);
   SetIndexStyle(1,DRAW_HISTOGRAM, 0, 1, Lime);
   SetIndexBuffer(1, ExtMapBuffer2);
   SetIndexStyle(2,DRAW_HISTOGRAM, 0, 3, Red);
   SetIndexBuffer(2, ExtMapBuffer3);
   SetIndexStyle(3,DRAW_HISTOGRAM, 0, 3, Lime);
   SetIndexBuffer(3, ExtMapBuffer4);
//----
   SetIndexDrawBegin(0,5);
//---- indicator buffers mapping
   SetIndexBuffer(0,ExtMapBuffer1);
   SetIndexBuffer(1,ExtMapBuffer2);
   SetIndexBuffer(2,ExtMapBuffer3);
   SetIndexBuffer(3,ExtMapBuffer4);
   SetIndexBuffer(4,ExtMapBuffer5);
   SetIndexBuffer(5,ExtMapBuffer6);
   SetIndexBuffer(6,ExtMapBuffer7);
   SetIndexBuffer(7,ExtMapBuffer8);
//---- initialization done
   return(0);
  }
//+------------------------------------------------------------------+
//| Custor indicator deinitialization function                       |
//+------------------------------------------------------------------+
int deinit()
  {
//---- TODO: add your code here

//----
   return(0);
  }
//+------------------------------------------------------------------+
//| Custom indicator iteration function                              |
//+------------------------------------------------------------------+
int start()
  {
   double maOpen, maClose, maLow, maHigh;
   double haOpen, haHigh, haLow, haClose;
   if(Bars<=10) return(0);
   ExtCountedBars=IndicatorCounted();
//---- check for possible errors
   if (ExtCountedBars<0) return(-1);
//---- last counted bar will be recounted
   if (ExtCountedBars>0) ExtCountedBars--;
   int pos=Bars-ExtCountedBars-1;
   while(pos>=0)
     {
      maOpen=iMA(NULL,0,MaPeriod,0,MaMetod,MODE_OPEN,pos);
      maClose=iMA(NULL,0,MaPeriod,0,MaMetod,MODE_CLOSE,pos);
      maLow=iMA(NULL,0,MaPeriod,0,MaMetod,MODE_LOW,pos);
      maHigh=iMA(NULL,0,MaPeriod,0,MaMetod,MODE_HIGH,pos);

      haOpen=(ExtMapBuffer5[pos+1]+ExtMapBuffer6[pos+1])/2;
      haClose=(maOpen+maHigh+maLow+maClose)/4;
      haHigh=MathMax(maHigh, MathMax(haOpen, haClose));
      haLow=MathMin(maLow, MathMin(haOpen, haClose));

      if (haOpen<haClose)
        {
         ExtMapBuffer7[pos]=haLow;
         ExtMapBuffer8[pos]=haHigh;
        }
      else
        {
         ExtMapBuffer7[pos]=haHigh;
         ExtMapBuffer8[pos]=haLow;
        }
      ExtMapBuffer5[pos]=haOpen;
      ExtMapBuffer6[pos]=haClose;

 	   pos--;
     }

   int i;
   for(i=0; i<Bars; i++) ExtMapBuffer1[i]=iMAOnArray(ExtMapBuffer7,Bars,MaPeriod2,0,MaMetod2,i);
   for(i=0; i<Bars; i++) ExtMapBuffer2[i]=iMAOnArray(ExtMapBuffer8,Bars,MaPeriod2,0,MaMetod2,i);
   for(i=0; i<Bars; i++) ExtMapBuffer3[i]=iMAOnArray(ExtMapBuffer5,Bars,MaPeriod2,0,MaMetod2,i);
   for(i=0; i<Bars; i++) ExtMapBuffer4[i]=iMAOnArray(ExtMapBuffer6,Bars,MaPeriod2,0,MaMetod2,i);

//----
   return(0);
  }
//+------------------------------------------------------------------+
Comments