Ergodic
Download script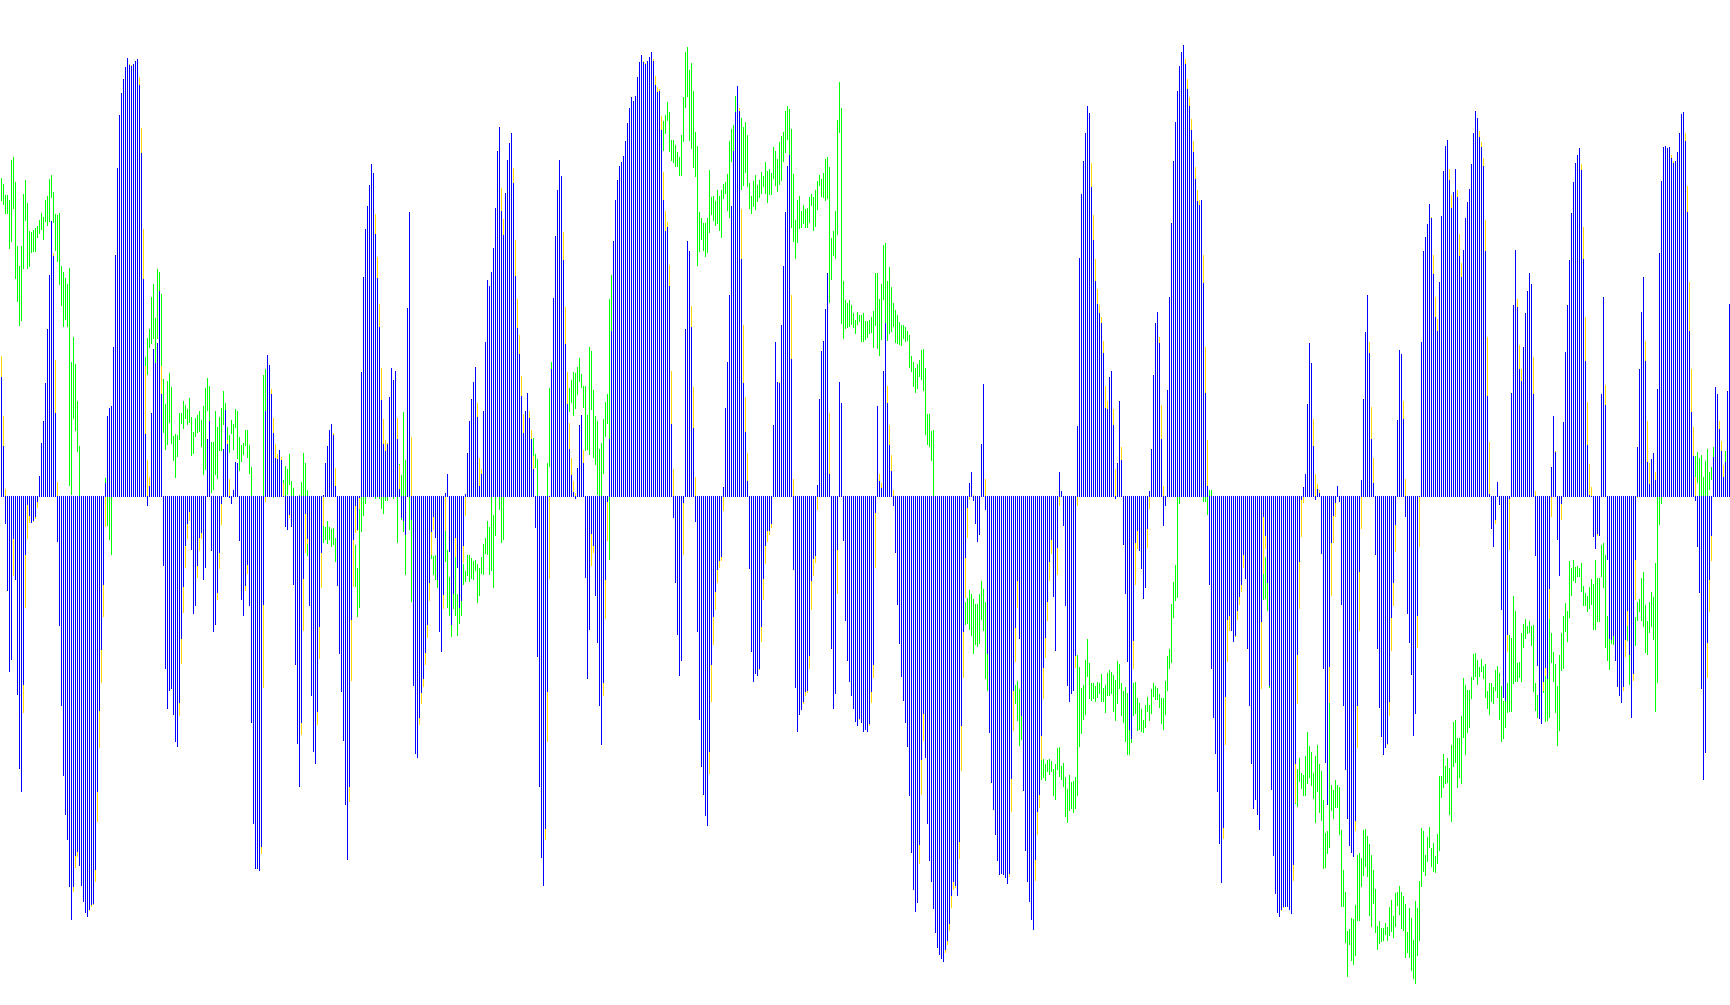
The Ergodic indicator is designed to provide traders with a visual representation of market momentum and trend strength by analyzing price fluctuations over specific time intervals. Rather than looking at raw price alone, the tool processes data through several layers of calculation to filter out "noise" and highlight the underlying direction of the market.
How the Logic Works
1. Price Difference Analysis The process begins by calculating the average price of each candle (combining the High, Low, and Close prices). The script then compares the current average price against a previous price point (determined by a user-defined lookback period). This creates two distinct types of data:
- Directional Change: This tracks whether the price is moving up or down.
- Magnitude of Change: This tracks the absolute size of the movement, regardless of direction.
2. Multi-Layer Smoothing (EMA) To ensure the indicator doesn't react erratically to every tiny price tick, the script applies multiple layers of Exponential Moving Averages (EMA).
- First, it smooths the directional and magnitude data to identify short-term trends.
- It then performs a second layer of smoothing to capture broader, more stable movements. This "double-smoothing" technique helps in identifying the primary trend while ignoring minor market volatility.
3. The Ergodic Calculation The core of the indicator is a ratio calculation. It takes the smoothed directional data and divides it by the smoothed magnitude data, then multiplies the result by 100. By comparing the "direction" to the "size" of the move, the tool produces a normalized percentage value.
4. Final Refinement A final smoothing pass is applied to this percentage value to create the visual output seen on your chart. This ensures that the resulting histogram is fluid and easy to read.
What This Means for the Trader
The final output appears as a histogram in a separate window. Because it uses a ratio of direction over magnitude, the indicator serves as a strength gauge:
- When the values are high and positive, it suggests strong upward momentum.
- When the values are low or negative, it indicates downward pressure.
- The smooth transitions allow traders to see where trends are gaining steam or beginning to lose energy, providing a clearer picture of market sentiment than raw price action alone.
//+------------------------------------------------------------------+
//| Danny Feng                                           Ergodic.mq4 |
//+------------------------------------------------------------------+

#property indicator_separate_window
#property indicator_buffers 1
#property indicator_color1 Yellow
#property indicator_color2 Red
//---- input parameters
extern int r=2;
extern int s=5;
extern int u=8;
extern int smooth=2;

//---- buffers
double ErgBuffer[];
double ema_ErgBuffer[];
double Price_Delta1_Buffer[];
double Price_Delta2_Buffer[];
double s_ema1_Buffer[];
double s_ema2_Buffer[];
double u_ema1_Buffer[];
double u_ema2_Buffer[];

//+------------------------------------------------------------------+
//| Custom indicator initialization function                         |
//+------------------------------------------------------------------+
int init()
  {
   string short_name;
//---- additional buffers are used for counting.
   IndicatorBuffers(8);
   SetIndexBuffer(0,ema_ErgBuffer);
   SetIndexBuffer(1,ErgBuffer);
   SetIndexBuffer(2,Price_Delta1_Buffer);
   SetIndexBuffer(3,Price_Delta2_Buffer);
   SetIndexBuffer(4,s_ema1_Buffer);
   SetIndexBuffer(5,s_ema2_Buffer);
   SetIndexBuffer(6,u_ema1_Buffer);
   SetIndexBuffer(7,u_ema2_Buffer);

//---- indicator lines
   SetIndexStyle(0,DRAW_HISTOGRAM);
   SetIndexStyle(1,DRAW_HISTOGRAM);
//---- name for DataWindow and indicator subwindow label
   short_name="Ergodic";
   IndicatorShortName(short_name);
   SetIndexLabel(0,short_name);
//----
   SetIndexDrawBegin(0,r+s+u+smooth);
   SetIndexDrawBegin(1,r+s+u+smooth);
//----
   return(0);
  }
//+------------------------------------------------------------------+
//| True Strength Index                                          |
//+------------------------------------------------------------------+
int start() {
   int i,limit;
   double mean1, mean2;

   int counted_bars=IndicatorCounted();
   if(counted_bars>0) counted_bars--;
   limit=Bars-counted_bars;

   for(i=0; i<limit; i++) {
      //Price_Delta1_Buffer[i] = Close[i] - Close[i+r];
      //Price_Delta2_Buffer[i] = MathAbs(Close[i] - Close[i+r]);
      mean1 = (Close[i] + High[i] + Low[i]) /3;
      mean2 = (Close[i+r] + High[i+r] + Low[i+r]) /3;
      Price_Delta1_Buffer[i] = mean1 - mean2;
      Price_Delta2_Buffer[i] = MathAbs(mean1 - mean2);
   }

   for(i=0; i<limit; i++) {
      s_ema1_Buffer[i]=iMAOnArray(Price_Delta1_Buffer,Bars,s,0,MODE_EMA,i);
      s_ema2_Buffer[i]=iMAOnArray(Price_Delta2_Buffer,Bars,s,0,MODE_EMA,i);
   }

   for(i=0; i<limit; i++) {
      u_ema1_Buffer[i]=iMAOnArray(s_ema1_Buffer,Bars,u,0,MODE_EMA,i);
      u_ema2_Buffer[i]=iMAOnArray(s_ema2_Buffer,Bars,u,0,MODE_EMA,i);
   }

   for(i=0; i<limit; i++) {
      ErgBuffer[i] = 100 * u_ema1_Buffer[i] / u_ema2_Buffer[i] ;
   }

   for(i=0; i<limit; i++) {
      ema_ErgBuffer[i] = iMAOnArray(ErgBuffer,Bars,smooth,0,MODE_EMA,i);
   }
   return(0);
}
//+------------------------------------------------------------------+
Comments