Triggerlines1
Download script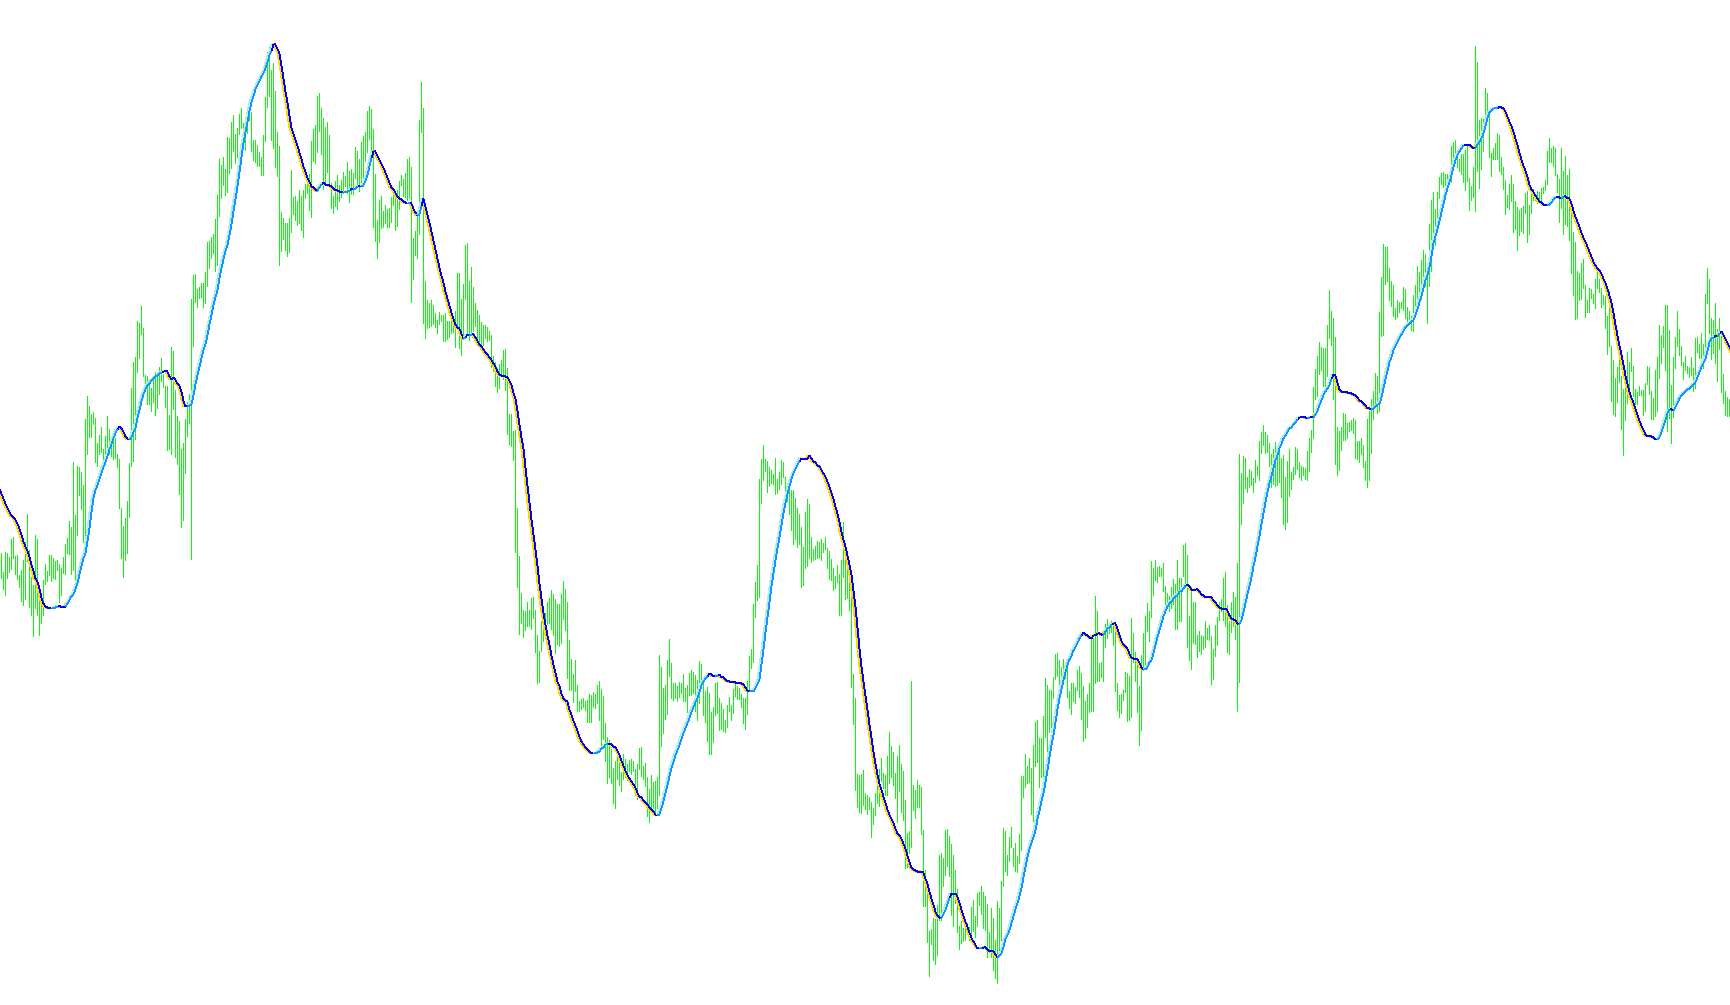
This tool is designed to provide traders with a visual representation of price momentum by identifying the relationship between two distinct moving averages. By analyzing historical price data, the script calculates specific mathematical trends to help users determine the underlying direction of the market.
How the Logic Works
1. Data Processing & Smoothing The indicator begins by looking at a set period of historical closing prices. Instead of using a standard simple average, it applies a weighted calculation. This means that price points closer to the present are given different significance than older data, allowing the tool to react more dynamically to recent market movements while maintaining a smoothed trend line.
2. The Dual-Line System The script generates two primary visual components on your chart:
- The Primary Trend (Weighted Line): This represents the immediate momentum of the price action based on the weighted calculations mentioned above.
- The Signal Line (Linear Smoothed Average): This acts as a secondary "filter." It processes the weighted data even further to create a smoother, slower-moving curve. This helps to distinguish between temporary market "noise" and actual long-term trend shifts.
3. Dynamic Visual Cues (Color Coding) The most important functional aspect of this tool is how it communicates information visually. Rather than just showing two lines constantly overlapping, the script uses logic to hide specific data points based on their relationship:
- When the Primary Trend sits above the Signal Line, it indicates positive momentum, and the indicator displays its primary visual markers.
- When the Primary Trend falls below the Signal Line, the indicator intentionally hides (empties) certain visual elements.
Practical Application
By observing when these lines interact and change their visibility, a trader can visually identify "crossovers." These moments often represent shifts in market sentiment—moving from a bullish phase to a bearish one, or vice versa. The logic is designed to keep the chart clean by only highlighting specific trend conditions, allowing for quicker identification of potential entry or exit points based on momentum shifts.
/*-----------------------------+
|			       |
| Shared by www.Aptrafx.com    |
|			       |
+------------------------------*/

//+------------------------------------------------------------------+
//|                                                     Trigger Line |
//|                             Copyright © 2005 dwt5 and adoleh2000 |
//|                                        http://www.metaquotes.net |
//+------------------------------------------------------------------+
#property  copyright "Copyright © 2005 dwt5 and adoleh2000 "
#property  link      "http://www.metaquotes.net/"

//---- indicator settings
#property  indicator_chart_window
#property  indicator_buffers 4
#property indicator_color1 Yellow
#property indicator_color2 Orange
#property indicator_color3 Aqua
#property indicator_color4 Blue

//---- buffers
double ExtMapBuffer1[];
double ExtMapBuffer2[];
double ExtMapBuffer3[];
double ExtMapBuffer4[];

int width;

extern int Rperiod = 50;
extern int LSMA_Period = 50;
int Draw4HowLong;
int shift;
int i;
int j;
int loopbegin;
int length;
int lsma_length;

double lengthvar;
double tmp ;
double tmp2 ;
double wt[];
double sum[];
double lsma_sum[];
double lsma_ma[];
double middle[];
int c;

//+------------------------------------------------------------------+
//| Custom indicator initialization function                         |
//+------------------------------------------------------------------+
int init()
  {
//---- 7 additional buffers are used for counting.
   IndicatorBuffers(7);

//---- drawing settings

   SetIndexBuffer(0,ExtMapBuffer1);
   SetIndexStyle(0,DRAW_LINE,STYLE_SOLID,2);

   SetIndexBuffer(1,ExtMapBuffer2);
   SetIndexStyle(1,DRAW_LINE,STYLE_SOLID,2);

   SetIndexBuffer(2,ExtMapBuffer3);
   SetIndexStyle(2,DRAW_LINE,STYLE_SOLID,2);

   SetIndexBuffer(3,ExtMapBuffer4);
   SetIndexStyle(3,DRAW_LINE,STYLE_SOLID,2);


   SetIndexBuffer(4,sum);
   SetIndexBuffer(5,wt);
   SetIndexBuffer(6,lsma_ma);

//---- initialization done
   return(0);
  }

int start()

  {   Draw4HowLong = Bars-Rperiod - 5;                            //Rperiod = 20
      length = Rperiod;                                           //length now = 20
      lsma_length = LSMA_Period;
      loopbegin = Draw4HowLong - length - 1;


      for(shift = loopbegin; shift >= 0; shift--)  //  MAIN For Loop
      {
         sum[1] = 0;
         for(i = length; i >= 1  ; i--)             //LSMA loop
         {
         lengthvar = length + 1;                               //lengthvar = 21
         lengthvar /= 3;                                       //lengthvar = 7
         tmp = 0;
         tmp = ( i - lengthvar)*Close[length-i+shift];         //tmp = 20 - 7 * close[20-i+shift]
         sum[1]+=tmp;
         }
         wt[shift] = sum[1]*6/(length*(length+1));
         j = shift;
         lsma_ma[shift] = wt[j+1] + (wt[j]-wt[j+1])* 2/(lsma_length+1);


//========== COLOR CODING ===========================================


            ExtMapBuffer1[shift] = wt[shift];
            ExtMapBuffer2[shift] = lsma_ma[shift];
            ExtMapBuffer3[shift] = wt[shift];
            ExtMapBuffer4[shift] = lsma_ma[shift];


            if (wt[shift]  < lsma_ma[shift])
            {
                ExtMapBuffer4[shift] = EMPTY_VALUE;
                ExtMapBuffer3[shift] = EMPTY_VALUE;
           }

        }
  }
//+------------------------------------------------------------------+
Comments