Trigger Line _v1
Download script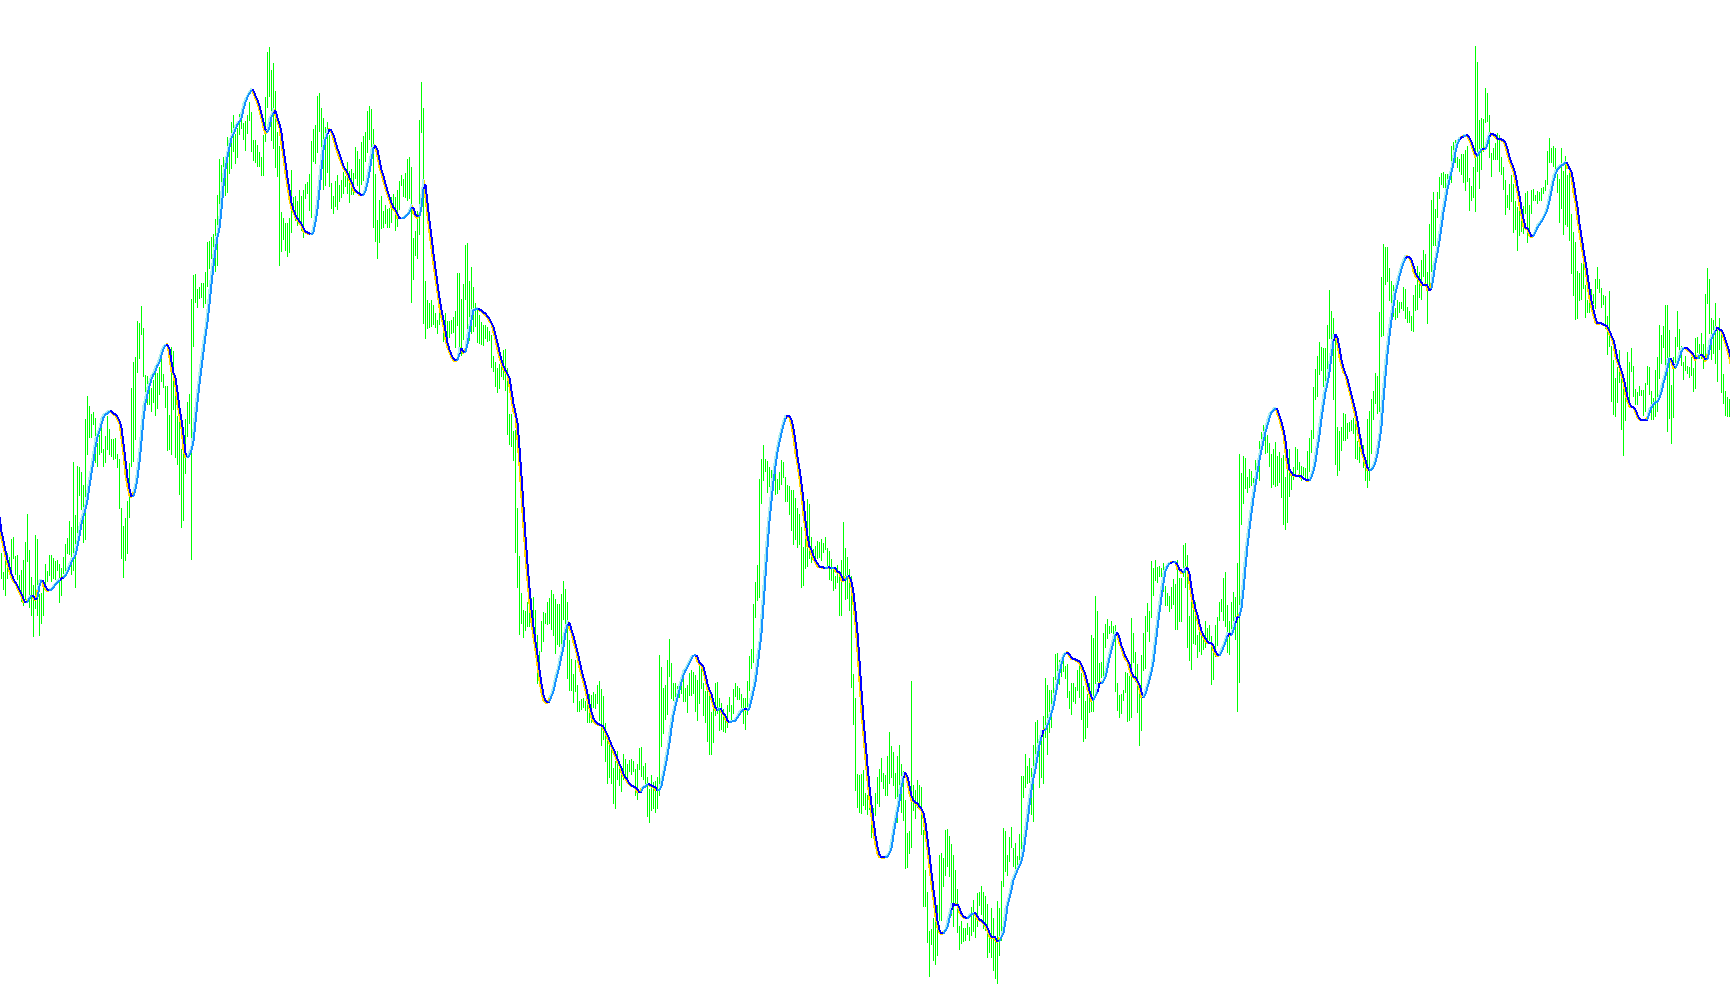
The Trigger Line indicator is designed to help traders visualize market momentum and identify specific trend transitions by comparing two distinct types of moving averages. Its primary goal is to filter out market "noise" and highlight periods where the price action shows significant strength or weakness.
How the Logic Works
The script operates by calculating two specific mathematical overlays on your chart:
1. The Weighted Momentum Line Instead of looking at simple averages, the tool calculates a weighted value based on a user-defined period. It assigns different importance to price points, allowing the indicator to react more dynamically to recent price movements. This serves as the primary "trigger" line, reflecting the immediate direction of the market flow.
2. The Smoothed Trend Line (LSMA) To provide context to that momentum, the script calculates a Linear Smoothed Moving Average (LSMA). This acts as a secondary filter. It takes the weighted data and smooths it out further to represent the broader, underlying trend of the asset.
Visual Behavior and Interpretation
The core logic of this tool lies in the relationship between these two lines:
- Active Signals: When the momentum line crosses above or behaves relative to the smoothed trend line, it indicates a specific movement in price action.
- Visual Filtering: The script includes a built-in "cleansing" logic. If the momentum value falls below the smoothed trend line, the indicator intentionally hides those segments (setting them to an empty value).
- The Result: This leaves only the most significant "active" signals visible on your chart. By removing the areas where the momentum is lagging or weak, the tool helps traders focus exclusively on periods where the market is showing decisive directional strength.
Summary for the Trader
In practical terms, this script acts as a filter. It calculates complex weighted averages to determine trend direction and then automatically "mutes" the data when it isn't showing significant momentum. This allows you to see clear, unobstructed visual cues of where the market is actively moving versus where it is simply consolidating or weakening.
/*-----------------------------+
|			       |
| Shared by www.Aptrafx.com    |
|			       |
+------------------------------*/

//+------------------------------------------------------------------+
//|                                                     Trigger Line |
//|                             Copyright © 2005 dwt5 and adoleh2000 |
//|                                        http://www.metaquotes.net |
//+------------------------------------------------------------------+
#property  copyright "Copyright © 2005 dwt5 and adoleh2000 "
#property  link      "http://www.metaquotes.net/"

//---- indicator settings
#property  indicator_chart_window
#property  indicator_buffers 4
#property indicator_color1 Red
#property indicator_color2 Red
#property indicator_color3 Blue
#property indicator_color4 Blue

//---- buffers
double ExtMapBuffer1[];
double ExtMapBuffer2[];
double ExtMapBuffer3[];
double ExtMapBuffer4[];

int width;

extern int Rperiod = 24;
extern int LSMA_Period = 6;
int Draw4HowLong;
int shift;
int i;
int j;
int loopbegin;
int length;
int lsma_length;

double lengthvar;
double tmp ;
double tmp2 ;
double wt[];
double sum[];
double lsma_sum[];
double lsma_ma[];
double middle[];
int c;

//+------------------------------------------------------------------+
//| Custom indicator initialization function                         |
//+------------------------------------------------------------------+
int init()
  {
//---- 7 additional buffers are used for counting.
   IndicatorBuffers(7);

//---- drawing settings

   SetIndexBuffer(0,ExtMapBuffer1);
   SetIndexStyle(0,DRAW_LINE,STYLE_SOLID,2);

   SetIndexBuffer(1,ExtMapBuffer2);
   SetIndexStyle(1,DRAW_LINE,STYLE_SOLID,2);

   SetIndexBuffer(2,ExtMapBuffer3);
   SetIndexStyle(2,DRAW_LINE,STYLE_SOLID,2);

   SetIndexBuffer(3,ExtMapBuffer4);
   SetIndexStyle(3,DRAW_LINE,STYLE_SOLID,2);


   SetIndexBuffer(4,sum);
   SetIndexBuffer(5,wt);
   SetIndexBuffer(6,lsma_ma);

//---- initialization done
   return(0);
  }

int start()

  {   Draw4HowLong = Bars-Rperiod - 5;                            //Rperiod = 20
      length = Rperiod;                                           //length now = 20
      lsma_length = LSMA_Period;
      loopbegin = Draw4HowLong - length - 1;


      for(shift = loopbegin; shift >= 0; shift--)  //  MAIN For Loop
      {
         sum[1] = 0;
         for(i = length; i >= 1  ; i--)             //LSMA loop
         {
         lengthvar = length + 1;                               //lengthvar = 21
         lengthvar /= 3;                                       //lengthvar = 7
         tmp = 0;
         tmp = ( i - lengthvar)*Open[length-i+shift];         //tmp = 20 - 7 * close[20-i+shift]
         sum[1]+=tmp;
         }
         wt[shift] = sum[1]*6/(length*(length+1));
         j = shift;
         lsma_ma[shift] = wt[j+1] + (wt[j]-wt[j+1])* 2/(lsma_length+1);


//========== COLOR CODING ===========================================


            ExtMapBuffer1[shift] = wt[shift];
            ExtMapBuffer2[shift] = lsma_ma[shift];
            ExtMapBuffer3[shift] = wt[shift];
            ExtMapBuffer4[shift] = lsma_ma[shift];

            if (wt[shift]  < lsma_ma[shift])
            {
                ExtMapBuffer4[shift] = EMPTY_VALUE;
                ExtMapBuffer3[shift] = EMPTY_VALUE;
           }

        }
  }
//+------------------------------------------------------------------+
Comments