Triggerlines Shift Modified_002
Download script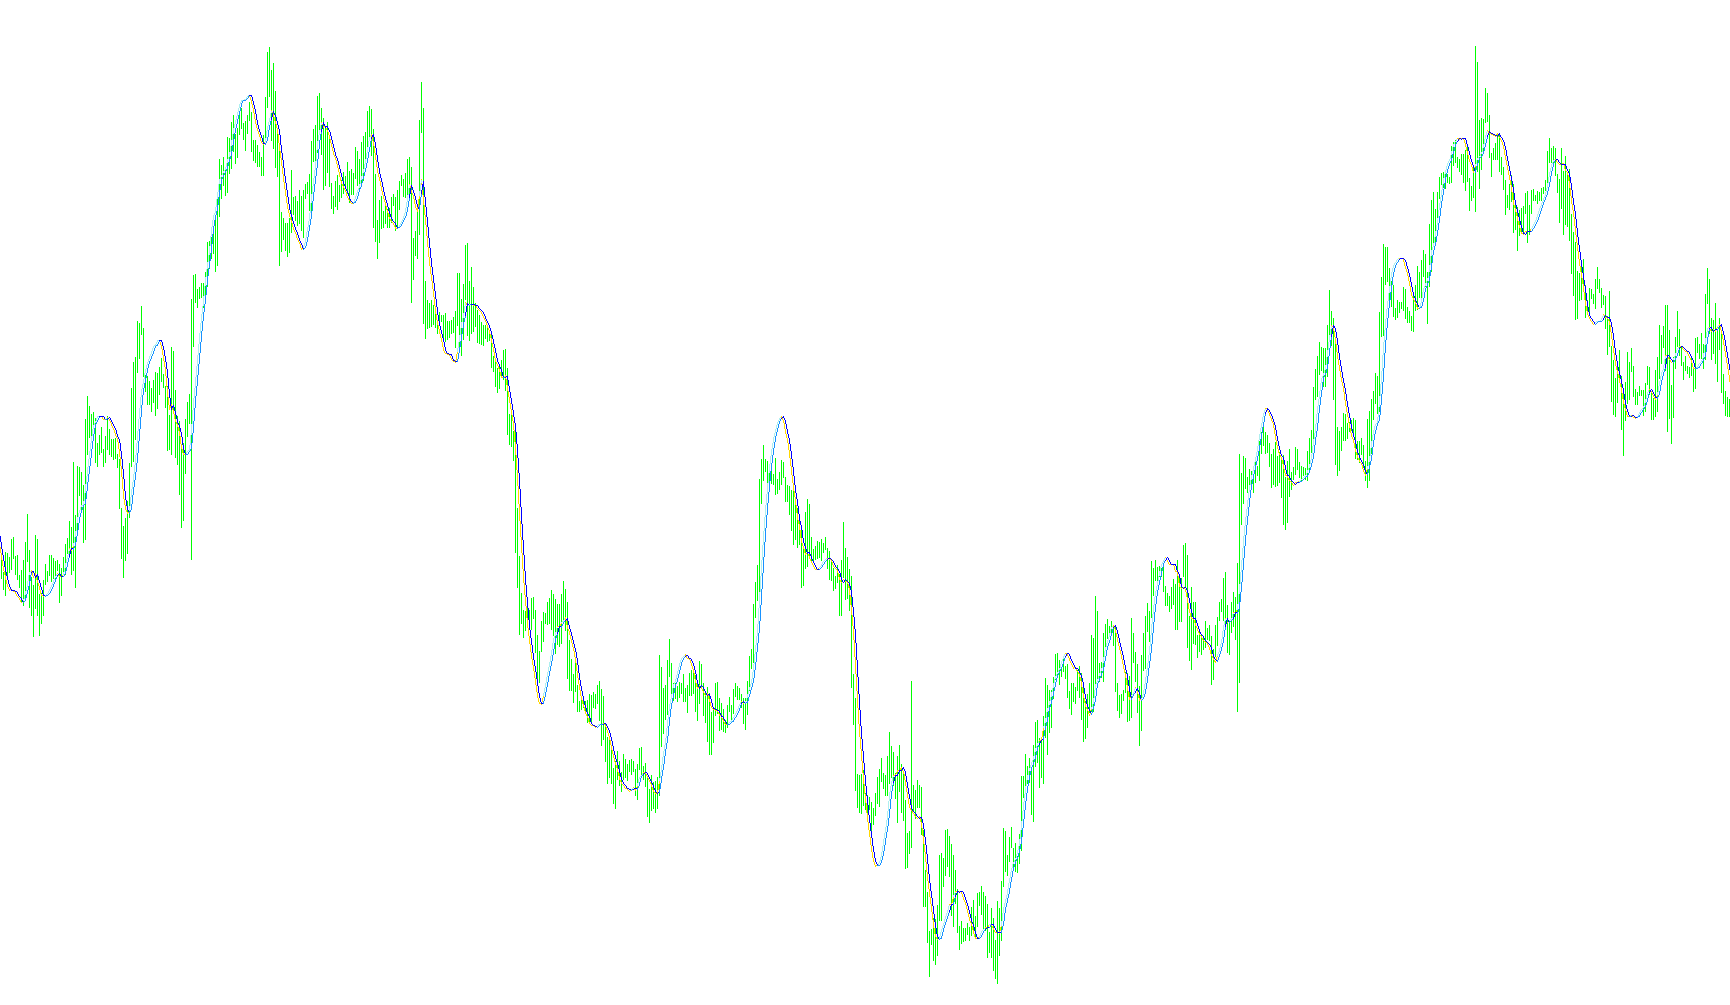
This script is designed as a visual technical analysis tool for the MetaTrader platform. Its primary purpose is to track price momentum and provide a clear visual signal of trend strength by comparing two different types of moving averages on your trading chart.
Core Logic and Functionality
The script works by calculating two distinct types of data lines simultaneously:
1. The Weighted Momentum Line Instead of looking at the price simply as it is, the script applies a specific weighting logic to the closing prices over a set period (determined by the "Rperiod" setting). It prioritizes price data in a way that highlights recent momentum. This results in a dynamic line that reacts to the current speed and direction of the market.
2. The Smoothed Trend Line (LSMA) The script then takes that weighted momentum and applies a secondary layer of smoothing (a Linear Weighted Moving Average). This creates a "baseline" trend. By smoothing the data, it filters out minor price fluctuations (noise) to reveal the broader underlying direction of the market.
Visual Interaction and Signals
The tool uses a specific color-coding logic to help traders identify high-probability areas:
- Trend Identification: The script plots these two lines on your chart so you can see how momentum relates to the overall trend.
- Dynamic Filtering: To simplify the visual experience, the script includes a conditional rule. It only displays specific lines when the weighted momentum is higher than the smoothed baseline.
- The "Trigger": When the momentum moves above the smoothed baseline, it signifies a potential shift in strength or a confirmed trend. If the momentum falls below this baseline, the script hides those specific markers (setting them to an empty value), effectively "cleaning" the chart so you only see the most relevant active signals.
Summary for the User
Essentially, this tool helps you separate the "noise" of the market from the actual trend. It calculates a momentum value and compares it against a smoothed average; by only showing you the data when these two values align in a specific way, it aims to highlight clear movements while filtering out confusing background price action.
//+------------------------------------------------------------------+
//|                                  Triggerlines Shift Modified.mq4 |
//|                      Copyright © 2006, MetaQuotes Software Corp. |
//|                                        http://www.metaquotes.net |
//+------------------------------------------------------------------+
#property copyright "Copyright © 2006, MetaQuotes Software Corp."
#property link      "http://www.metaquotes.net"


//---- indicator settings
#property  indicator_chart_window
#property  indicator_buffers 4
#property indicator_color1 Red
#property indicator_color2 Red
#property indicator_color3 Blue
#property indicator_color4 Blue

//---- buffers
double ExtMapBuffer1[];
double ExtMapBuffer2[];
double ExtMapBuffer3[];
double ExtMapBuffer4[];

int width;

extern int Rperiod = 20;
extern int RperiodShift = 0;
extern int LSMA_Period = 20;
extern int LSMA_PeriodShift = 0;
int Draw4HowLong;
int shift;
int i;
int j;
int loopbegin;
int length;
int lsma_length;

double lengthvar;
double tmp ;
double tmp2 ;
double wt[];
double sum[];
double lsma_sum[];
double lsma_ma[];
double middle[];
int c;

//+------------------------------------------------------------------+
//| Custom indicator initialization function                         |
//+------------------------------------------------------------------+
int init()
  {
//---- 7 additional buffers are used for counting.
   IndicatorBuffers(7);

//---- drawing settings

   SetIndexBuffer(0,ExtMapBuffer1);
   SetIndexStyle(0,DRAW_LINE,STYLE_SOLID,1);
   SetIndexShift(0,LSMA_PeriodShift);
   SetIndexBuffer(1,ExtMapBuffer2);
   SetIndexStyle(1,DRAW_LINE,STYLE_SOLID,1);
   SetIndexShift(1,LSMA_PeriodShift);
   SetIndexBuffer(2,ExtMapBuffer3);
   SetIndexStyle(2,DRAW_LINE,STYLE_SOLID,1);
   SetIndexShift(2,RperiodShift);
   SetIndexBuffer(3,ExtMapBuffer4);
   SetIndexStyle(3,DRAW_LINE,STYLE_SOLID,1);
   SetIndexShift(3,RperiodShift);


   SetIndexBuffer(4,sum);
   SetIndexBuffer(5,wt);
   SetIndexBuffer(6,lsma_ma);

//---- initialization done
   return(0);
  }

int start()

  {   Draw4HowLong = Bars-Rperiod - 5;                            //Rperiod = 20
      length = Rperiod;                                           //length now = 20
      lsma_length = LSMA_Period;
      loopbegin = Draw4HowLong - length - 1;


      for(shift = loopbegin; shift >= 0; shift--)  //  MAIN For Loop
      {
         sum[1] = 0;
         for(i = length; i >= 1  ; i--)             //LSMA loop
         {
         lengthvar = length + 1;                               //lengthvar = 21
         lengthvar /= 3;                                       //lengthvar = 7
         tmp = 0;
         tmp = ( i - lengthvar)*Close[length-i+shift];         //tmp = 20 - 7 * close[20-i+shift]
         sum[1]+=tmp;
         }
         wt[shift] = sum[1]*6/(length*(length+1));
         j = shift;
         lsma_ma[shift] = wt[j+1] + (wt[j]-wt[j+1])* 2/(lsma_length+1);


//========== COLOR CODING ===========================================


            ExtMapBuffer1[shift] = wt[shift];
            ExtMapBuffer2[shift] = lsma_ma[shift];
            ExtMapBuffer3[shift] = wt[shift];
            ExtMapBuffer4[shift] = lsma_ma[shift];


            if (wt[shift]  < lsma_ma[shift])
            {
                ExtMapBuffer4[shift] = EMPTY_VALUE;
                ExtMapBuffer3[shift] = EMPTY_VALUE;
           }

        }
  }
//+------------------------------------------------------------------+
Comments