Triggerlines_001
Download script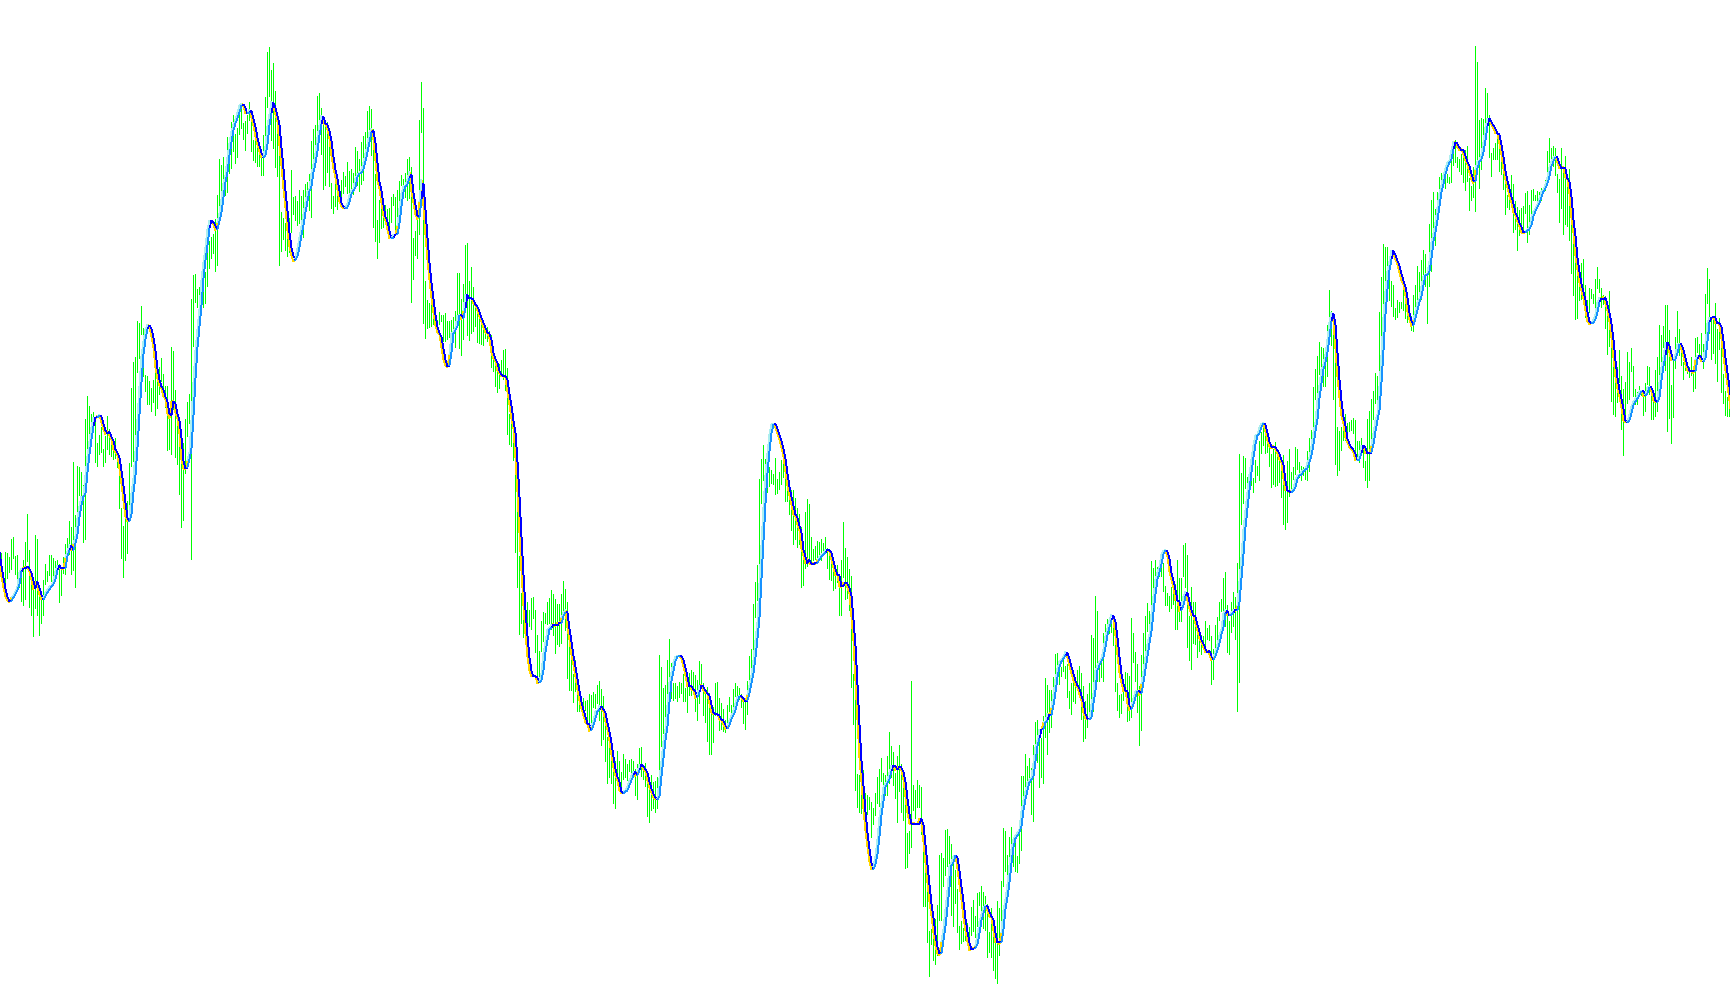
The Trigger Line indicator is designed to provide visual clarity on a trading chart by identifying specific momentum trends and potential entry points. It achieves this by calculating a specialized moving average and comparing it against a weighted baseline to highlight active market movements.
How the Logic Works
The script operates by processing historical price data to create two distinct types of mathematical lines:
1. The Weighted Calculation (The Baseline) Instead of using a standard simple moving average, the script calculates a "weighted" value based on specific periods. It looks at the closing prices over a set duration and applies a weighted distribution. This means it gives different levels of importance to certain price points within that timeframe, allowing the indicator to react more dynamically to recent price changes than a traditional average would.
2. The Linear Smoothed Average (The Trigger) The script then takes those weighted values and applies a secondary smoothing layer (similar to a Linear Standard Moving Average). This creates a smoother "trigger" line that follows the primary weighted movement but filters out minor market noise, making it easier for a trader to see the prevailing trend.
Visual Interpretation and Behavior
The core intelligence of this script lies in its conditional coloring logic. It does not simply draw two lines constantly; rather, it acts as a filter for your visual analysis:
- Active Signal State: The indicator displays both the primary weighted line and the smoothed trigger line simultaneously only when the weighted value is higher than the smoothed average.
- Filtering Out Noise: When the market conditions do not meet this specific "trigger" criteria (specifically, when the weighted value falls below the smoothed average), the script hides those lines entirely.
Summary for Traders
By using this logic, the indicator serves as a visual filter. It effectively "shuts off" during periods of insignificant movement or bearish pressure and "lights up" to show you clear paths when the momentum meets your specific criteria. It is designed to help you stay focused on the most relevant price actions while stripping away the visual clutter of the rest of the market.
//+------------------------------------------------------------------+
//|                                                     Trigger Line |
//|                             Copyright © 2005 dwt5 and adoleh2000 |
//|                                        http://www.metaquotes.net |
//+------------------------------------------------------------------+
#property  copyright "Copyright © 2005 dwt5 and adoleh2000 "
#property  link      "http://www.metaquotes.net/"

//---- indicator settings
#property  indicator_chart_window
#property  indicator_buffers 4
#property indicator_color1 Red
#property indicator_color2 Red
#property indicator_color3 Blue
#property indicator_color4 Blue
#property indicator_width1 2
#property indicator_width2 2
#property indicator_width3 2

//---- buffers
double ExtMapBuffer1[];
double ExtMapBuffer2[];
double ExtMapBuffer3[];
double ExtMapBuffer4[];

int width;

extern int Rperiod = 15;
extern int LSMA_Period = 15;
int Draw4HowLong;
int shift;
int i;
int j;
int loopbegin;
int length;
int lsma_length;

double lengthvar;
double tmp ;
double tmp2 ;
double wt[];
double sum[];
double lsma_sum[];
double lsma_ma[];
double middle[];
int c;

//+------------------------------------------------------------------+
//| Custom indicator initialization function                         |
//+------------------------------------------------------------------+
int init()
  {
//---- 7 additional buffers are used for counting.
   IndicatorBuffers(7);

//---- drawing settings

   SetIndexBuffer(0,ExtMapBuffer1);
   SetIndexStyle(0,DRAW_LINE,STYLE_SOLID,2);

   SetIndexBuffer(1,ExtMapBuffer2);
   SetIndexStyle(1,DRAW_LINE,STYLE_SOLID,2);

   SetIndexBuffer(2,ExtMapBuffer3);
   SetIndexStyle(2,DRAW_LINE,STYLE_SOLID,2);

   SetIndexBuffer(3,ExtMapBuffer4);
   SetIndexStyle(3,DRAW_LINE,STYLE_SOLID,2);


   SetIndexBuffer(4,sum);
   SetIndexBuffer(5,wt);
   SetIndexBuffer(6,lsma_ma);

//---- initialization done
   return(0);
  }

int start()

  {   Draw4HowLong = Bars-Rperiod - 5;                            //Rperiod = 20
      length = Rperiod;                                           //length now = 20
      lsma_length = LSMA_Period;
      loopbegin = Draw4HowLong - length - 1;


      for(shift = loopbegin; shift >= 0; shift--)  //  MAIN For Loop
      {
         sum[1] = 0;
         for(i = length; i >= 1  ; i--)             //LSMA loop
         {
         lengthvar = length + 1;                               //lengthvar = 21
         lengthvar /= 3;                                       //lengthvar = 7
         tmp = 0;
         tmp = ( i - lengthvar)*Close[length-i+shift];         //tmp = 20 - 7 * close[20-i+shift]
         sum[1]+=tmp;
         }
         wt[shift] = sum[1]*6/(length*(length+1));
         j = shift;
         lsma_ma[shift] = wt[j+1] + (wt[j]-wt[j+1])* 2/(lsma_length+1);


//========== COLOR CODING ===========================================


            ExtMapBuffer1[shift] = wt[shift];
            ExtMapBuffer2[shift] = lsma_ma[shift];
            ExtMapBuffer3[shift] = wt[shift];
            ExtMapBuffer4[shift] = lsma_ma[shift];


            if (wt[shift]  < lsma_ma[shift])
            {
                ExtMapBuffer4[shift] = EMPTY_VALUE;
                ExtMapBuffer3[shift] = EMPTY_VALUE;
           }

        }
  }
//+------------------------------------------------------------------+
Comments