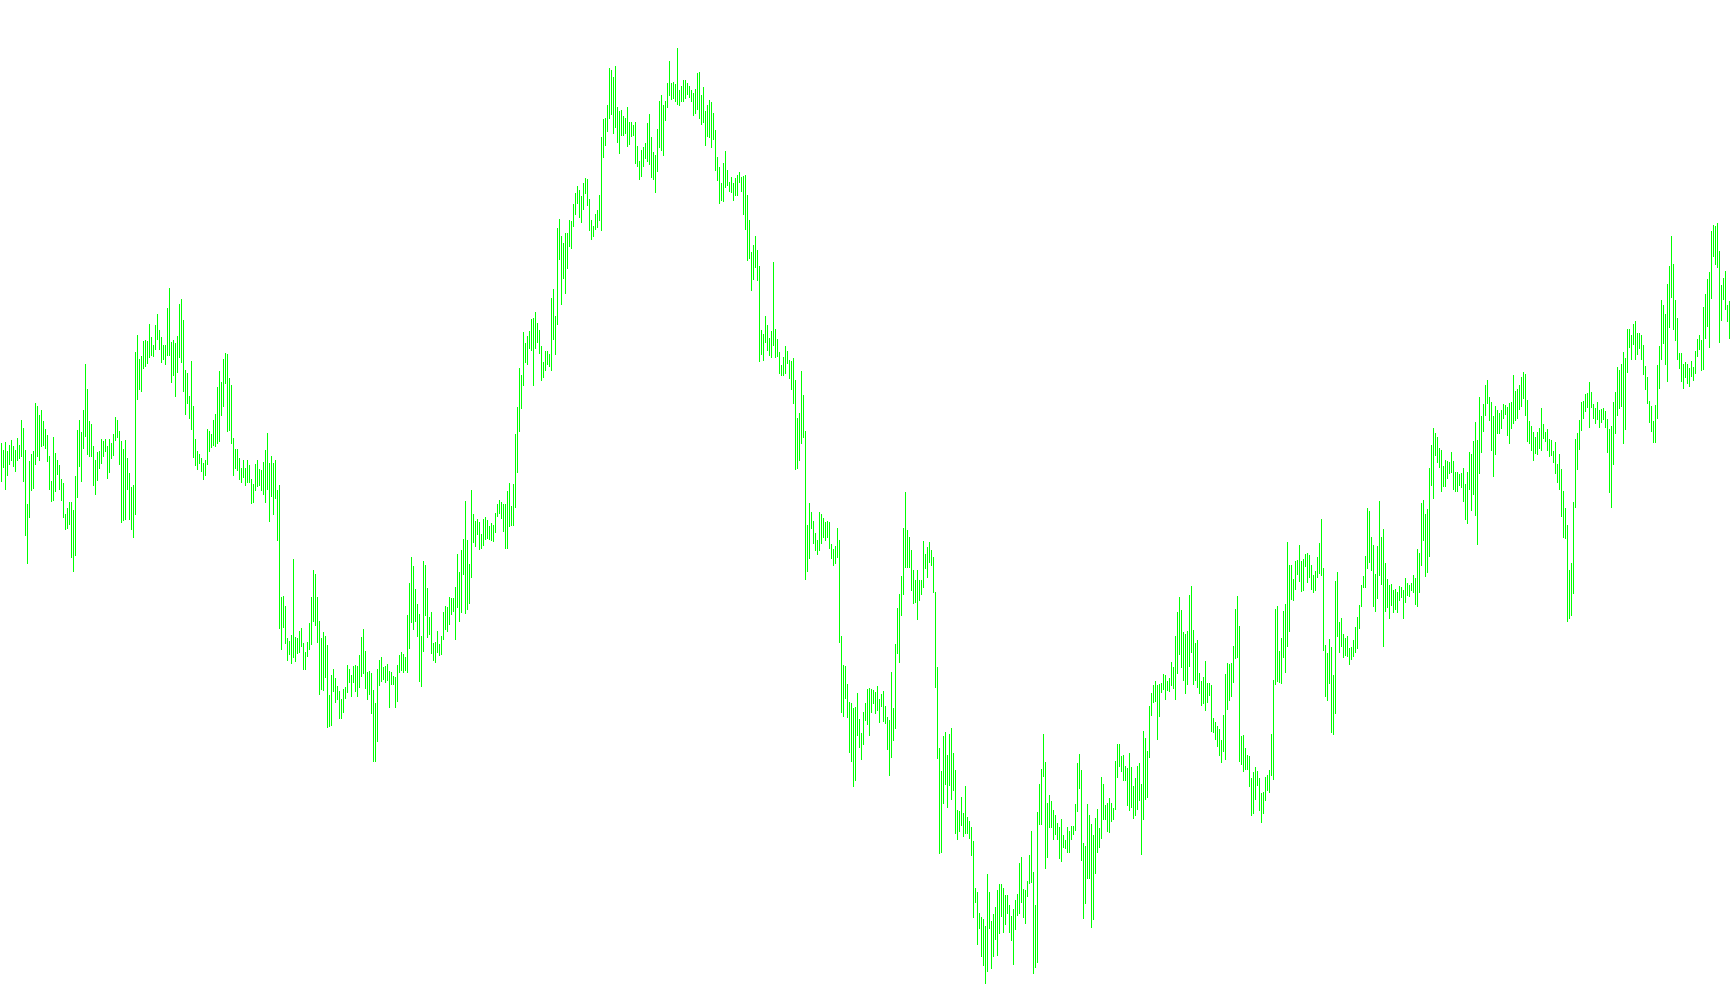
This tool is designed to identify and plot specific "Pivot Points" on your trading chart based on the price action of the previous trading day. It serves as a visual guide to help traders understand key price levels where the market might find support or resistance.
How the Logic Works
1. Identifying Daily Transitions The script constantly monitors the timeline of the market to detect when a new trading day begins. It looks for the exact moment the clock rolls over to midnight to trigger its calculations for that specific period.
2. Calculating Previous Day Statistics Once a new day is identified, the tool "looks back" at the entirety of the preceding day's price movement. Specifically, it captures three key pieces of data from that completed session:
- The highest price reached (High).
- The lowest price reached (Low).
- The closing price of the final candle.
3. Dynamic Pivot Formulae The script offers two different ways to calculate the "Pivot" level based on a user-defined setting:
- Standard Calculation: A balanced average of the previous day's high, low, and close.
- Weighted Calculation: A variation that places more mathematical significance (weight) on the previous day's closing price, which can be useful for identifying trends where the "closing sentiment" is more important than the extreme highs or lows.
4. Visualizing the Data Instead of cluttering your chart with constant lines, the script intelligently manages how it displays these levels:
- New Day Markers: It places the calculated pivot level specifically at the start of a new day.
- Current Session Handling: The script includes logic to handle the "live" bar. It ensures that as the current day progresses, the chart remains clean by managing the values and avoiding messy overlaps during active trading hours.
5. Compatibility & Constraints To ensure accuracy, the tool is optimized for shorter timeframes (specifically those under 4 hours). This ensures that the daily calculation remains relevant to the immediate price action you are viewing on your screen.
//+------------------------------------------------------------------+
//|                                                   ^Dyn_Pivot.mq4 |
//|                                      Modest, Rosh conversed only |
//|                           http://forexsystems.ru/phpBB/index.php |
//+------------------------------------------------------------------+
#property copyright "Modest, Rosh conversed only"
#property link      "http://forexsystems.ru/phpBB/index.php"
//----
#property indicator_chart_window
#property indicator_buffers 1
#property indicator_color1 DarkGreen
//---- input parameters
extern int       Formula=0;
int i=1, shift;
double FP=0.0;
double FH=0.0, FL=0.0;
bool result;
//---- buffers
double ExtMapBuffer1[];
//+------------------------------------------------------------------+
//| Ïðîâåðêà íîâîãî äíÿ                                              |
//+------------------------------------------------------------------+
bool isNewDay(int _shift)
  {
//----
   result=false;
   if((TimeHour(Time[_shift])==0)  && (TimeMinute(Time[_shift])==0)  )result=true;
//----
   return(result);
  }
//+------------------------------------------------------------------+
//| Ïîëó÷èòü óðîâåíü FP ïðîøåäøåãî äíÿ                               |
//+------------------------------------------------------------------+
double GetFPofDay(int _shift)
  {
   int prevDay=TimeDay(Time[_shift+1]);
//----
   i=1;
   while(TimeDay(Time[_shift+i])==prevDay) i++;
   i--;
   FH=High[Highest(NULL,0,MODE_HIGH,i,_shift+1)];
   FL=Low[Lowest(NULL,0,MODE_LOW,i,_shift+1)];
   if (Formula==0) FP=NormalizeDouble((FH+FL+Close[_shift+1])/3.0,Digits);
   else FP=NormalizeDouble((FH+FL+2*Close[_shift+1])/4.0,Digits);
//----
   return(FP);
  }
//+------------------------------------------------------------------+
//| Ðàáîòà â íóëåâîì áàðå                                            |
//+------------------------------------------------------------------+
void SetNullBarValue(int _shift)
  {
   int cnt;
   int currDay=TimeDay(Time[_shift]);
//----
   i=1;
   while(TimeDay(Time[_shift+i])==currDay) i++;
   if (i>=2)
     {
      i=i-2;
      for(cnt=i;cnt>0;cnt--) ExtMapBuffer1[shift+cnt]=0.0;
      FH=High[Highest(NULL,0,MODE_HIGH,i+1,_shift)];
      FL=Low[Lowest(NULL,0,MODE_LOW,i+1,_shift)];
      if (Formula==0) FP=NormalizeDouble((FH+FL+Close[_shift+1])/3.0,Digits);
      else FP=NormalizeDouble((FH+FL+2*Close[_shift+1])/4.0,Digits);
      ExtMapBuffer1[_shift]=FP;
     }
//----
   return;
  }
//+------------------------------------------------------------------+
//| Custom indicator initialization function                         |
//+------------------------------------------------------------------+
int init()
  {
   if (Formula!=0)Formula=1;
   string label="FP("+Formula+")";
//---- indicators
   SetIndexStyle(0,DRAW_SECTION);
   SetIndexBuffer(0,ExtMapBuffer1);
   SetIndexEmptyValue(0,0.0);
   SetIndexLabel(0,label);
//----
   return(0);
  }
//+------------------------------------------------------------------+
//| Custor indicator deinitialization function                       |
//+------------------------------------------------------------------+
int deinit()
  {
//----
//----
   return(0);
  }
//+------------------------------------------------------------------+
//| Custom indicator iteration function                              |
//+------------------------------------------------------------------+
int start()
  {
   int limit,firstDay;
   int counted_bars=IndicatorCounted();
   if (counted_bars<0) return(0);
   if (counted_bars==0)
     {
      limit=Bars-1;
      i=1;
      firstDay=TimeDay(Time[limit]);
      while(TimeDay(Time[limit-i])==firstDay) i++;
      limit=limit-i-PERIOD_D1/Period();
     }
   if (counted_bars>0) limit=Bars-counted_bars;
//----
   if (Period()>PERIOD_H4) return;
   for(shift=limit;shift>=0;shift--)
     {
      if (isNewDay(shift)) ExtMapBuffer1[shift]=GetFPofDay(shift); else  ExtMapBuffer1[shift]=0.0;
      if (shift==0) SetNullBarValue(shift);
     }
//----
   return(0);
  }
//+------------------------------------------------------------------+
Comments