T3 MACO
Download script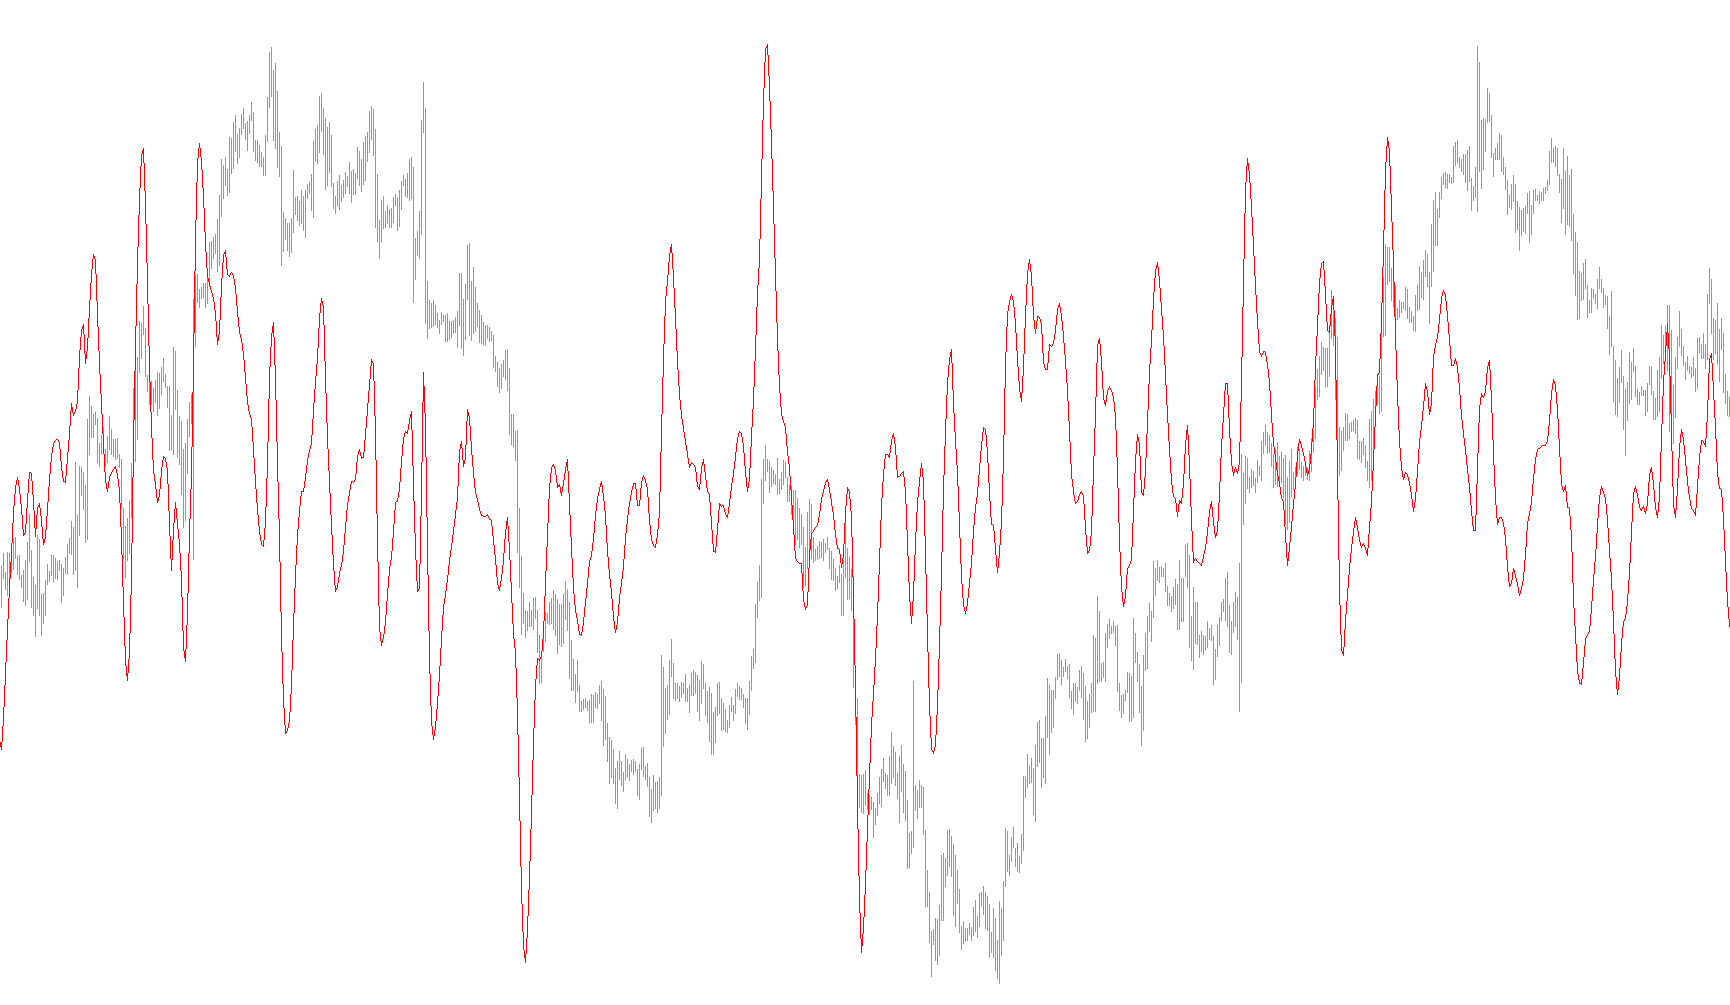
This tool is a specialized technical analysis indicator designed to help traders identify trends by smoothing out market price fluctuations. Instead of showing raw, jagged price movements, it processes the data through a multi-layered mathematical filter to produce a cleaner, more reliable visual signal.
How the Logic Works
The indicator operates based on three core concepts:
1. Dynamic Data Comparison The script begins by looking at two different types of Moving Averages (EMAs) simultaneously. It specifically compares the difference between a "Fast" moving average—which reacts quickly to recent price changes—and a "Slow" moving average, which reflects the broader trend. By calculating the gap between these two, the tool attempts to isolate the momentum of the market.
2. Multi-Stage Smoothing (The "T3" Effect) Rather than simply taking that difference and drawing it on your screen, the script passes the information through a series of recursive calculations. It performs six consecutive rounds of mathematical weighting. Think of this like passing water through multiple filters; each step reduces "noise" (random price spikes) while preserving the underlying direction of the trend. This specific method is designed to minimize the typical "lag" found in standard moving averages, making the indicator more responsive to real-time changes.
3. Weighted Calculation The tool uses a customizable coefficient (the "b" value) to determine how much weight to give to each stage of the calculation. By applying these weights across the six stages, the script creates a final output line that is significantly smoother than traditional indicators. This helps traders avoid "false starts"—where a small, insignificant price wiggle might otherwise look like a significant trend change.
Summary for the Trader
The end result is a smooth red line displayed in a separate window. Because it processes the data through multiple layers of smoothing and weighting, it aims to provide a clearer picture of whether the market momentum is strengthening or weakening without the distracting "jitter" caused by minor price volatility.
//+------------------------------------------------------------------+
//|                                                      T3MACO.mq4  |
//|                                                          Perky_z |
//| http://groups.yahoo.com/group/MetaTrader_Experts_and_Indicators/ |
//+------------------------------------------------------------------+
#property copyright "Perky_z hack of Mojos Program"
#property link      "http://groups.yahoo.com/group/MetaTrader_Experts_and_Indicators/"

#property indicator_separate_window
#property indicator_buffers 1
#property indicator_color1 Red

extern int MA_Period = 5;
extern double b = 0.7;

double MapBuffer[];
extern int FastEMA=5;
extern int SlowEMA=8;
double e1,e2,e3,e4,e5,e6;
double c1,c2,c3,c4;
double n,w1,w2,b2,b3;

//+------------------------------------------------------------------+
//| Custom indicator initialization function                         |
//+------------------------------------------------------------------+
int init()
  {
//---- indicators setting
    SetIndexStyle(0,DRAW_LINE,STYLE_SOLID,1,Red);
    IndicatorDigits(MarketInfo(Symbol(),MODE_DIGITS));
    IndicatorShortName("T3_ MACO "+MA_Period);

    SetIndexBuffer(0,MapBuffer);

//---- variable reset

    e1=0; e2=0; e3=0; e4=0; e5=0; e6=0;
    c1=0; c2=0; c3=0; c4=0;
    n=0;
    w1=0; w2=0;
    b2=0; b3=0;

    b2=b*b;
    b3=b2*b;
    c1=-b3;
    c2=(3*(b2+b3));
    c3=-3*(2*b2+b+b3);
    c4=(1+3*b+b3+3*b2);
    n=MA_Period;

    if (n<1) n=1;
    n = 1 + 0.5*(n-1);
    w1 = 2 / (n + 1);
    w2 = 1 - w1;

//----
    return(0);
  }

//+------------------------------------------------------------------+
//| Custom indicator iteration function                              |
//+------------------------------------------------------------------+
int start()
  {
   int limit=Bars;

//---- indicator calculation

    for(int i=limit; i>=0; i--)
    {
        e1 = w1*(iMA(NULL,0,FastEMA,0,MODE_EMA,PRICE_CLOSE,i)-iMA(NULL,0,SlowEMA,0,MODE_EMA,PRICE_OPEN,i)) + w2*e1;
        e2 = w1*e1 + w2*e2;
        e3 = w1*e2 + w2*e3;
        e4 = w1*e3 + w2*e4;
        e5 = w1*e4 + w2*e5;
        e6 = w1*e5 + w2*e6;

        MapBuffer[i]=c1*e6 + c2*e5 + c3*e4 + c4*e3;
    }
//----
   return(0);
  }
//+------------------------------------------------------------------+
Comments