StepMA_v6
Download script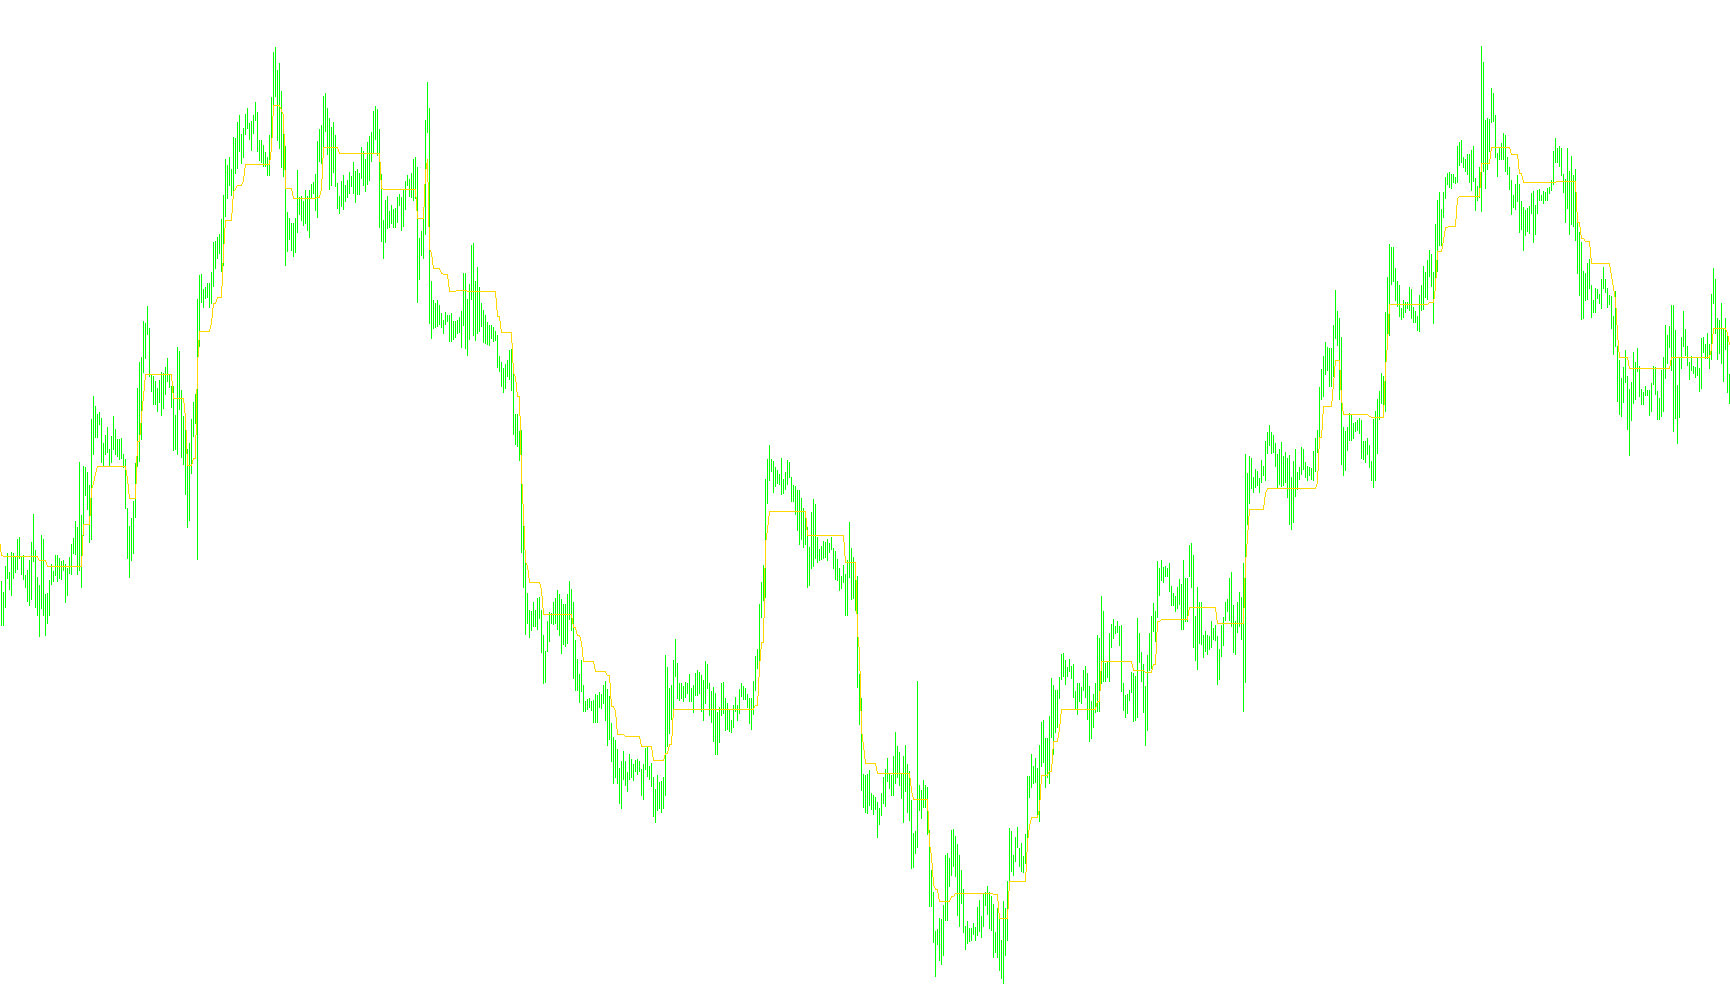
This indicator, known as the StepMA, is designed to help traders identify and visualize market trends by creating a "staircase" style moving average. Unlike traditional moving averages that provide a smooth, flowing line, this tool focuses on highlighting significant price movements and shifts in momentum.
Core Logic and Functionality
The primary objective of this script is to filter out market "noise" and provide a clearer picture of the prevailing direction. It achieves this through several key logical steps:
1. Volatility Measurement The script begins by analyzing the market's volatility using the Average True Range (ATR). By looking at recent price history, it determines how much the market typically moves over a specific period. This allows the indicator to automatically adjust its "step" height based on current market conditions—meaning it expands during high volatility and shrinks during quieter periods.
2. The "Step" Mechanism Instead of moving price-by-price, the indicator calculates a specific price buffer (a "Step").
- If the price moves significantly enough to break past this buffer, the indicator acknowledges a potential trend change.
- If the price stays within the buffer, the line remains flat (horizontal), creating the signature staircase effect.
3. Trend Identification and Direction The logic constantly compares current closing prices against the established boundaries of the previous step:
- Upward Trend: If the price breaks above a certain threshold, the indicator identifies an upward move and "steps up" to a new higher level. It ensures that these steps only move forward in time, preventing the line from retracing downward unless a significant enough reversal occurs.
- Downward Trend: Conversely, if the price falls below a lower threshold, the indicator "steps down."
4. Customizable Sensitivity The script provides several ways to fine-tune how it reacts to the market:
- Sensitivity Factor: Users can adjust how aggressively the line reacts to new price data.
- High/Low Mode: This allows users to choose whether the calculation should be based on the "Close" price (standard) or a combination of "High/Low" prices (more sensitive to extreme wicks and spikes).
- Constant Step Size: While it usually calculates steps automatically based on volatility, users have the option to force a fixed, manual step size for more rigid control.
Visual Output
The indicator provides a clear visual guide on the chart:
- A primary Staircase Line that shows the current trend level.
- Trend Arrows/Markers: Depending on the settings, it can highlight specific trend shifts with directional symbols.
- Color Coding: When enabled, the line can change colors to visually distinguish between bullish (upward) and bearish (downward) movements, making it easier for traders to identify trend flips at a glance.
In summary, this tool is built for traders who prefer to see "structural" changes in price rather than smooth averages, providing a cleaner visual representation of market momentum and support/resistance levels.
//+------------------------------------------------------------------+
//|                                                    StepMA_v6.mq4 |
//|                           Copyright © 2005, TrendLaboratory Ltd. |
//|                                       E-mail: igorad2004@list.ru |
//+------------------------------------------------------------------+
#property copyright "Copyright © 2005, TrendLaboratory Ltd."
#property link      "E-mail: igorad2004@list.ru"

#property indicator_chart_window
#property indicator_buffers 3
#property indicator_color1 LightBlue
#property indicator_color2 Blue
#property indicator_color3 Red
//---- input parameters
extern int     Length=10;      // ATR Length
extern double  Kv=1.0;         // Sensivity Factor
extern int     StepSize=0;     // Constant Step Size (if need)
extern int     Advance=0;      // Offset
extern bool    HighLow=false;  // High/Low Mode Switch (more sensitive)
extern bool    Color=false;    // Color Mode Switch
//---- indicator buffers
double LineBuffer[];
double UpBuffer[];
double DnBuffer[];

//+------------------------------------------------------------------+
//| Custom indicator initialization function                         |
//+------------------------------------------------------------------+
  int init()
  {
   string short_name;
//---- indicator line
   SetIndexStyle(0,DRAW_LINE,STYLE_SOLID,1);
   SetIndexStyle(1,DRAW_ARROW);
   SetIndexStyle(2,DRAW_ARROW);
   SetIndexArrow(1,159);
   SetIndexArrow(2,159);
   SetIndexShift(0,Advance);
   SetIndexShift(1,Advance);
   SetIndexShift(2,Advance);
   SetIndexBuffer(0,LineBuffer);
   SetIndexBuffer(1,UpBuffer);
   SetIndexBuffer(2,DnBuffer);
   IndicatorDigits(MarketInfo(Symbol(),MODE_DIGITS));
//---- name for DataWindow and indicator subwindow label
   short_name="StepMA("+StepSize+","+Kv+","+StepSize+")";
   IndicatorShortName(short_name);
   SetIndexLabel(0,short_name);
   SetIndexLabel(1,"UpTrend");
   SetIndexLabel(2,"DownTrend");
//----
   SetIndexDrawBegin(0,Length);
   SetIndexDrawBegin(1,Length);
   SetIndexDrawBegin(2,Length);
//----
   return(0);
  }

//+------------------------------------------------------------------+
//| StepMA_v6                                                         |
//+------------------------------------------------------------------+
int start()
  {
   int i,shift,trend,Step;
   double smin0,smax0,smin1,smax1,ATRmin=10000,ATRmax=0;


   for(shift=Bars-1;shift>=0;shift--) LineBuffer[shift]=0.0;


   for(shift=Bars-1-Length;shift>=0;shift--)
   {

	ATRmax=MathMax(iATR(NULL,0,Length,shift),ATRmax);
	ATRmin=MathMin(iATR(NULL,0,Length,shift),ATRmin);

	if( StepSize>0 )
	{Step=StepSize;}
	else
	{Step=0.5*Kv*(ATRmax+ATRmin)/Point;}

	Comment (" StepSize= ", Step);
	if (HighLow)
	  {
	  smax0=Low[shift]+2.0*Step*Point;
	  smin0=High[shift]-2.0*Step*Point;
     }
	else
	  {
	  smax0=Close[shift]+2.0*Step*Point;
	  smin0=Close[shift]-2.0*Step*Point;
	  }

	  if (Close[shift]>smax1)  trend=1;
	  if (Close[shift]<smin1)  trend=-1;

	  if(trend>0)
	  {
	  if(smin0<smin1) smin0=smin1;
	  LineBuffer[shift]=smin0+Step*Point;
	  if(Color) UpBuffer[shift]=smin0+Step*Point;
	  }
	  else
	  {
	  if(smax0>smax1) smax0=smax1;
	  LineBuffer[shift]=smax0-Step*Point;
	  if(Color) DnBuffer[shift]=smax0-Step*Point;
	  }
	  smin1=smin0;
	  smax1=smax0;
	 }
	return(0);
 }
Comments