StarcBands
Download script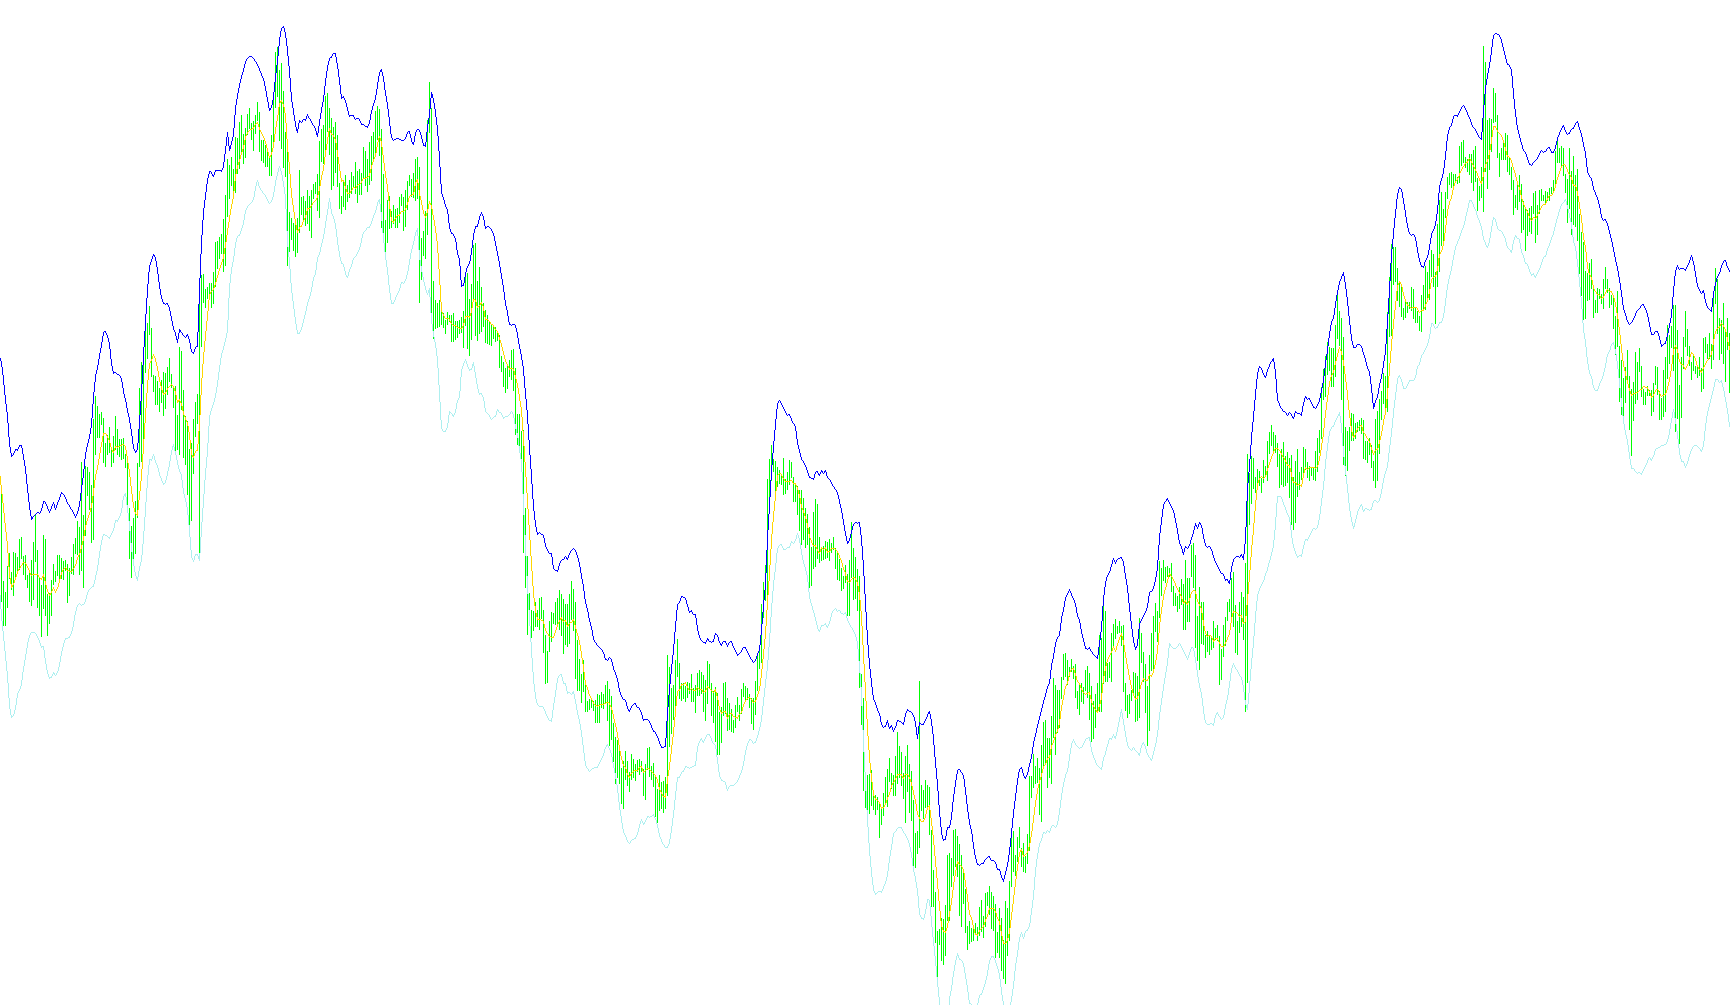
This custom trading indicator is designed to provide visual guidance on price movements by identifying trends and potential volatility boundaries. It functions by calculating three distinct components: a central moving average line, an upper boundary, and a lower boundary.
Core Logic Overview
The tool operates by analyzing historical price data to determine the "normal" behavior of an asset over a specific timeframe. It then projects a corridor around that movement, helping traders visualize where the price is currently trending and how far it has deviated from its recent average.
How the Components Work
1. The Central Trend Line (Moving Average) The heart of the indicator is a moving average. Rather than looking at just one single price point, it calculates the average closing price over a user-defined period (e.g., the last 6 candles). This smooths out minor market "noise," allowing you to see the underlying direction of the price more clearly.
2. The Volatility Boundaries (Upper and Lower Bands) To determine the width of the boundaries, the script uses a specialized calculation based on two factors:
- Price Deviation: It measures how far the current price has strayed from the central moving average over the designated period.
- Average True Range (ATR): It incorporates a volatility metric that accounts for the typical range of price movement.
By multiplying these factors together, the script creates an "envelope" or "band" around the center line.
Visual Interpretation
- Upper Boundary: This represents the ceiling of expected price movement based on current volatility. When the price touches or exceeds this line, it may suggest that the asset is becoming overextended or "overbought" in the short term.
- Lower Boundary: This represents the floor of expected price movement. If the price drops to or below this line, it might indicate that the asset is reaching an extreme low for the current trend, potentially suggesting it is "oversold."
- The Center Line: This acts as the equilibrium point. When the price is between the two boundaries, it is considered to be moving within its normal expected range.
Summary of Operation
In simple terms, this script looks at where the price has been to predict a range for where the price is likely to stay. It creates a dynamic "channel" that expands when the market is volatile and contracts when the market is calm, providing a visual tool to help identify potential turning points in the market.
//+------------------------------------------------------------------+
//|                                                   StarcBands.mq4 |
//|                      Copyright © 2005, MetaQuotes Software Corp. |
//|                                       http://www.metaquotes.net/ |
//|                                                    Linuxser 2007 |
//+------------------------------------------------------------------+
#property copyright "Copyright © 2005, MetaQuotes Software Corp."
#property link      "http://www.metaquotes.net/"
//----
#property indicator_chart_window
#property indicator_buffers 3
#property indicator_color1 Purple
#property indicator_color2 Blue
#property indicator_color3 Red
//---- indicator parameters
extern int    BandsPeriod = 6;
extern int    ATR = 15;
extern double Multiplier = 2.0;
extern int    BandsShift = 0;
//---- buffers
double MovingBuffer[];
double UpperBuffer[];
double LowerBuffer[];
//+------------------------------------------------------------------+
//| Custom indicator initialization function                         |
//+------------------------------------------------------------------+
int init()
  {
//---- indicators
   SetIndexStyle(0, DRAW_LINE);
   SetIndexBuffer(0, MovingBuffer);
   SetIndexStyle(1, DRAW_LINE);
   SetIndexBuffer(1, UpperBuffer);
   SetIndexStyle(2, DRAW_LINE);
   SetIndexBuffer(2, LowerBuffer);
//----
   SetIndexDrawBegin(0, BandsPeriod + BandsShift);
   SetIndexDrawBegin(1, BandsPeriod + BandsShift);
   SetIndexDrawBegin(2, BandsPeriod + BandsShift);
//----
   return(0);
  }
//+------------------------------------------------------------------+
//| Bollinger Bands                                                  |
//+------------------------------------------------------------------+
int start()
  {
   int i, k, counted_bars = IndicatorCounted();
   double deviation;
   double sum, oldval, newres;
//----
   if(Bars <= BandsPeriod)
       return(0);
//---- initial zero
   if(counted_bars < 1)
       for(i = 1; i <= BandsPeriod; i++)
         {
           MovingBuffer[Bars-i] = EMPTY_VALUE;
           UpperBuffer[Bars-i] = EMPTY_VALUE;
           LowerBuffer[Bars-i] = EMPTY_VALUE;
         }
//----
   int limit = Bars - counted_bars;
   if(counted_bars > 0)
       limit++;
   for(i = 0; i < limit; i++)
       MovingBuffer[i] = iMA(NULL, 0, BandsPeriod, BandsShift,
                             MODE_SMA, PRICE_CLOSE, i);
//----
   i = Bars - BandsPeriod + 1;
   if(counted_bars > BandsPeriod - 1)
       i = Bars - counted_bars - 1;
   while(i >= 0)
     {
       sum = 0.0;
       k = i + BandsPeriod - 1;
       oldval = MovingBuffer[i];
       while(k >= i)
         {
           newres = Close[k] - oldval;
           sum += newres*newres;
           k--;
         }
       deviation = Multiplier*iATR(NULL, 0, ATR, i); // MathSqrt(sum / BandsPeriod);
       UpperBuffer[i] = oldval + deviation;
       LowerBuffer[i] = oldval - deviation;
       i--;
     }
//----
   return(0);
  }
//+------------------------------------------------------------------+
Comments