AD_OsWAD_macdosma4c
Download script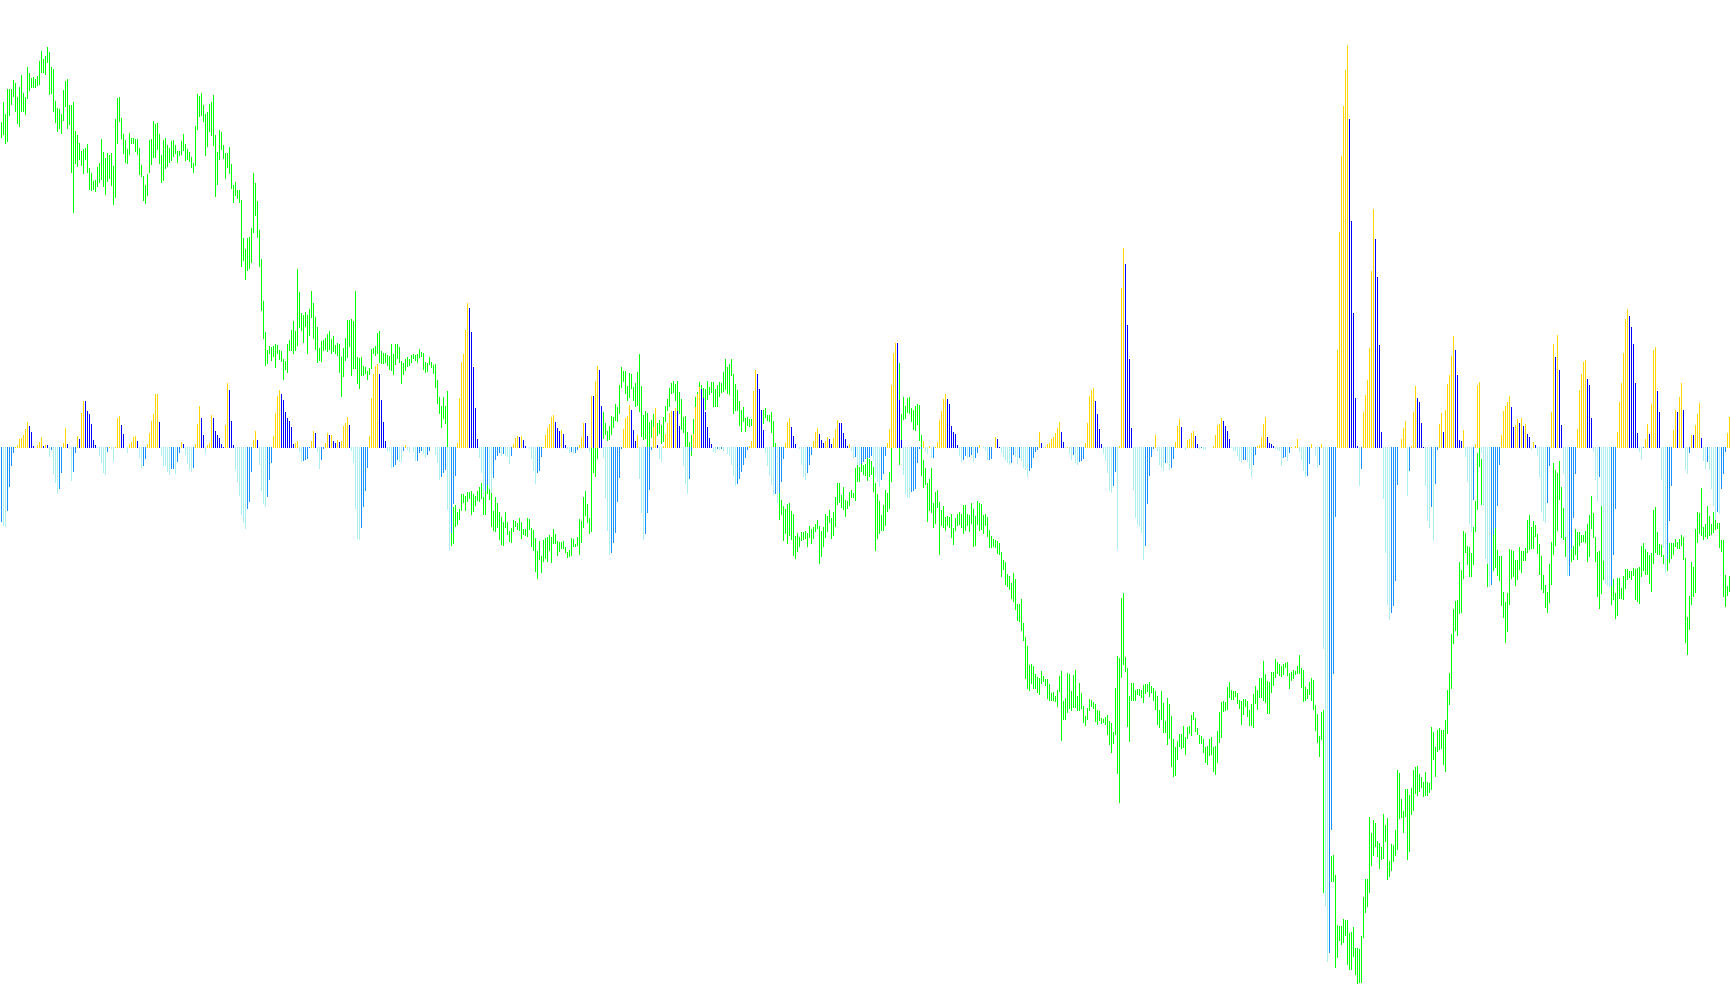
This technical indicator is designed to analyze market momentum and price trends by processing multiple layers of moving averages. It serves as a visual tool to help traders identify the strength, direction, and velocity of price movements in real-time.
Core Logic and Data Processing
The script operates through a multi-stage calculation process:
- Base Average Calculation: The logic begins by calculating an Awesome Dollar (AD) value. This serves as the foundational data point from which all other calculations are derived.
- Trend Differentiation: The indicator then applies two different Moving Averages to that base data using specific periods and modes. By subtracting one moving average from the other, the script isolates the difference between short-term and long-term trends. This highlights how quickly the price is moving relative to its historical average.
- Signal Smoothing: To filter out market "noise" and provide a cleaner visual, the script applies an additional smoothing layer (a signal line) over the differentiated trend data.
Visual Representation and Interpretation
The indicator translates these complex mathematical differences into a color-coded histogram that changes based on two primary factors: Direction and Momentum.
-
Positive Momentum (Upward Movement): When the calculated trend is positive, the indicator reflects upward pressure. It distinguishes between "accelerating" and "decelerating" movement:
- If the current momentum is higher than the previous bar, it highlights a strengthening bullish trend.
- If the momentum is positive but decreasing, it suggests that while the price is still moving up, the strength of that move is cooling off.
-
Negative Momentum (Downward Movement): When the calculated trend is negative, the indicator reflects downward pressure:
- If the current momentum is lower than the previous bar, it highlights a strengthening bearish trend.
- If the momentum is negative but increasing (moving back toward zero), it suggests that the downward move is losing its intensity.
Summary for the User
By observing the height and color transitions of the histogram, a user can quickly determine if the market is currently in a state of healthy growth, weakening strength, or accelerating decline. It simplifies complex trend-following mathematics into a clear, visual representation of price "velocity."
//+------------------------------------------------------------------+
//
// Bookkeeper: Îñöèëëÿòîð íà îñíîâå èíäèêàòîðà:
//+------------------------------------------------------------------+
//|                                         Waddah_Attar_Def_RSI.mq4 |
//|                              Copyright © 2007, Eng. Waddah Attar |
//|                                          waddahattar@hotmail.com |
//+------------------------------------------------------------------+
//----
#property  indicator_separate_window
#property  indicator_buffers 4
#property  indicator_color1  Lime
#property  indicator_color2  Green
#property  indicator_color3  Red
#property  indicator_color4  Maroon

#property indicator_width1   2
#property indicator_width2   2
#property indicator_width3   2
#property indicator_width4   2

//----
//extern int Period1=14;
//extern int Period2=28;

extern int smzPeriod1=5;
extern int smzPeriod2=13;
extern int smzMaMode1=1;
extern int smzMaMode2=0;
extern int sigPeriod =7;
extern int sigMaMode =0;
extern bool showOsma=true;

double   up_buffer1[];
double   up_buffer2[];
double   dn_buffer1[];
double   dn_buffer2[];
double   ind_buffer1[];
double   ind_buffer2[];
double   ind_buffer3[];
double   MABuffer1[];

//+------------------------------------------------------------------+
//|                                                                  |
//+------------------------------------------------------------------+
int init()
  {
   IndicatorBuffers(8);
   SetIndexStyle(0, DRAW_HISTOGRAM);
   SetIndexStyle(1, DRAW_HISTOGRAM);
   SetIndexStyle(2, DRAW_HISTOGRAM);
   SetIndexStyle(3, DRAW_HISTOGRAM);
//----
   SetIndexBuffer(0, up_buffer1);
   SetIndexBuffer(1, up_buffer2);
   SetIndexBuffer(2, dn_buffer1);
   SetIndexBuffer(3, dn_buffer2);
   SetIndexBuffer(4, ind_buffer1);
   SetIndexBuffer(5, MABuffer1);
   SetIndexBuffer(6, ind_buffer2);
   SetIndexBuffer(7, ind_buffer3);
//----
   string snm="macd";if (showOsma)snm="osma";

   IndicatorShortName("OsWAD AD ("+smzPeriod1+","+smzPeriod2+") "+snm);

   return(0);
  }
//+------------------------------------------------------------------+
//|                                                                  |
//+------------------------------------------------------------------+
int deinit()
  {
//----
   return(0);
  }
//+------------------------------------------------------------------+
//|                                                                  |
//+------------------------------------------------------------------+
int start()
  {
   double RSI1,RSI2,Explo;

   int  limit, i, counted_bars = IndicatorCounted();
//----
   if(counted_bars < 0)
       return(-1);
//----
   if(counted_bars > 0)
       counted_bars--;
   limit = Bars - counted_bars;
//----
   for(i = limit; i >= 0; i--)
   {
     MABuffer1[i]   = iAD(NULL, 0,  i);
//   ind_buffer1[i] = iAD(NULL, 0, Period2, i);
   }


   for(i = 0; i <= limit; i++)
     ind_buffer2[i]= iMAOnArray(MABuffer1,0,smzPeriod1,0,smzMaMode1,i)-
                     iMAOnArray(MABuffer1,0,smzPeriod2,0,smzMaMode2,i);

   for(i = 0; i <= limit; i++)
     ind_buffer3[i]= iMAOnArray(ind_buffer2,0,sigPeriod,0,sigMaMode,i);


   for(i = 0; i <= limit; i++)
   {
            double os = 0.0, os1 = 0.0;
                        if (showOsma)  {  os  =ind_buffer3[i];
                                          os1 =ind_buffer3[i+1];
                                          }

      double  curr =ind_buffer2[i]  -os;
      double  prev =ind_buffer2[i+1]-os1;


     if(curr >0)
     {
        dn_buffer1[i]=0;
        dn_buffer2[i]=0;
        if(curr>prev)
        {
           up_buffer1[i]=curr;
           up_buffer2[i]=0;
        }
        else
        {
           up_buffer1[i]=0;
           up_buffer2[i]=curr;
        }
     }
     else
     {
        up_buffer1[i]=0;
        up_buffer2[i]=0;
        if(curr<prev)
        {
           dn_buffer1[i]=curr;
           dn_buffer2[i]=0;
        }
        else
        {
           dn_buffer1[i]=0;
           dn_buffer2[i]=curr;
        }
     }
   }
   return(0);
}
//+------------------------------------------------------------------+
Comments