StepMA_v6.3
Download script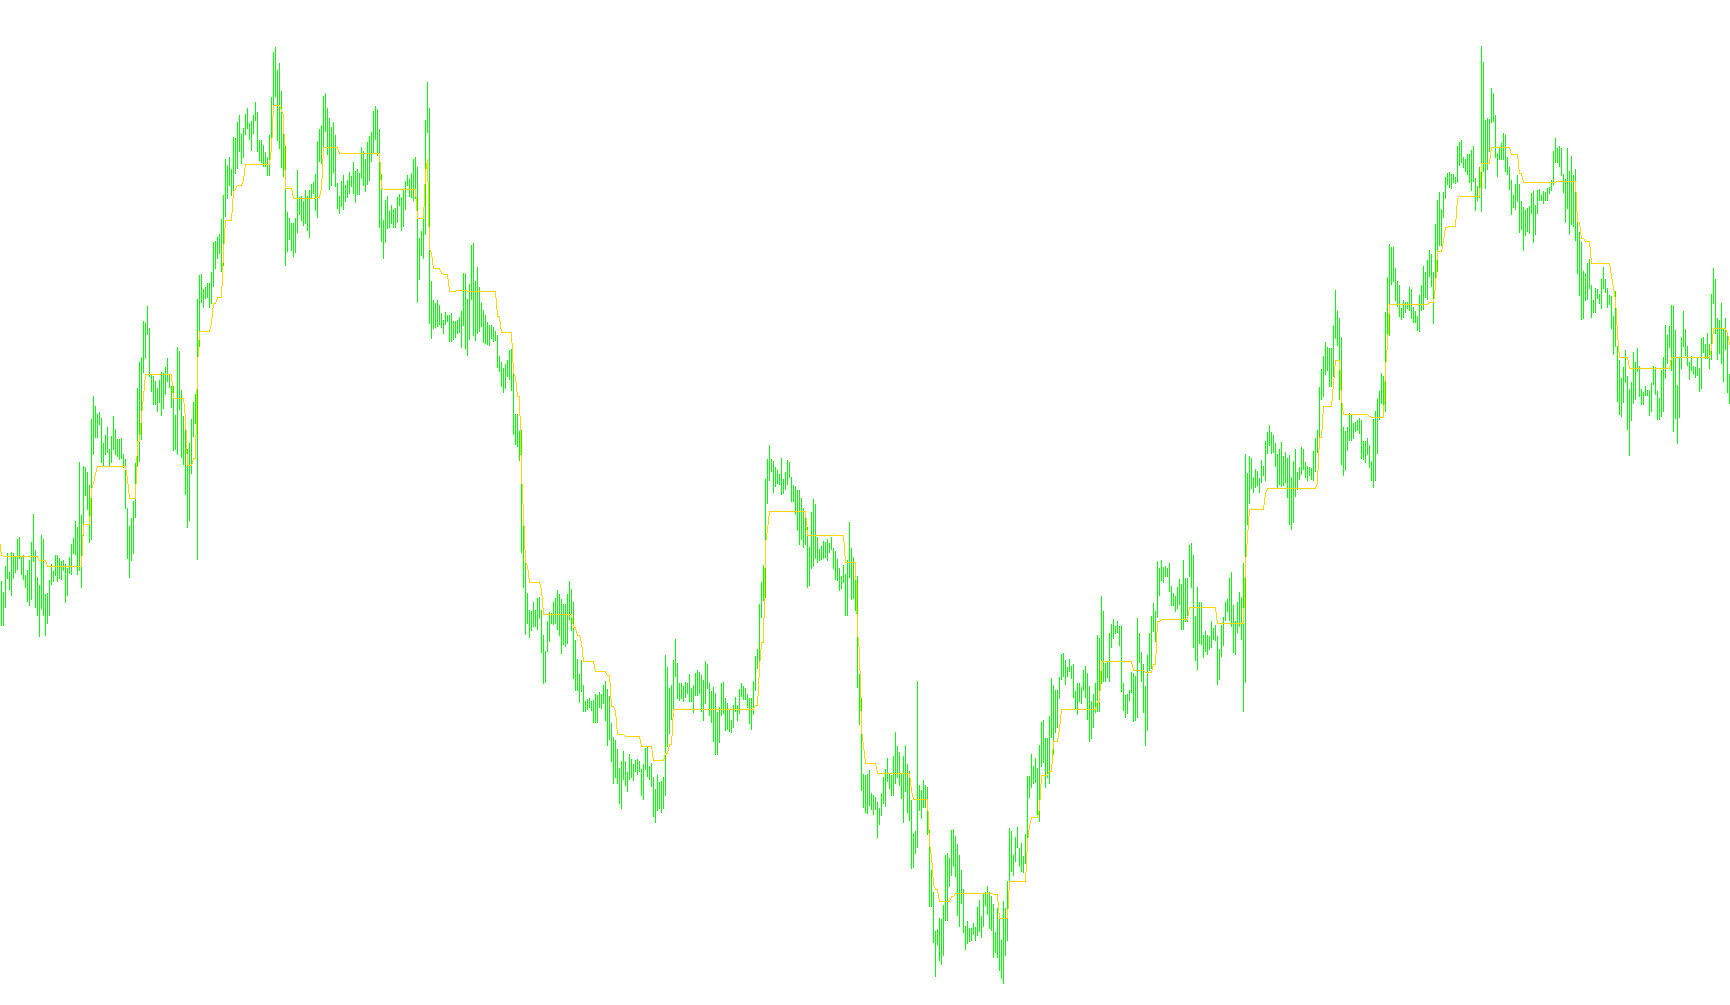
This technical indicator, known as the StepMA, is designed to provide a visual representation of market trends by creating a "stepped" moving average. Unlike traditional moving averages that produce smooth, continuous curves, this tool moves in discrete levels (steps), making it easier for traders to identify clear trend shifts and structural boundaries in price action.
Core Logic and Mechanism
1. Dynamic Volatility Measurement The indicator begins by analyzing the market's volatility. It calculates the average range of price movement over a specific lookback period. Depending on the user settings, it identifies the maximum and minimum volatility encountered to establish a "Step Size." This ensures that the size of the steps is proportional to the current market environment—expanding during high volatility and tightening during calmer periods.
2. Trend Detection Strategy The logic operates by monitoring price "breaches." It establishes upper and lower boundaries based on the calculated Step Size.
- If the price closes above a certain boundary, the indicator identifies an upward trend.
- If the price closes below a corresponding boundary, it identifies a downward trend.
3. The "Step" Behavior The defining characteristic of this script is how it handles price movement within a trend:
- In an Uptrend: The indicator seeks to hold its level as long as possible. It only moves upward when the price forces it to, essentially creating a floor that follows the price upward in chunks rather than a smooth climb.
- In a Downtrend: Conversely, the indicator acts as a ceiling. It remains at its current level until the price action forces it to drop lower, creating a staircase effect downward.
4. Visual Identification and Customization The script provides several ways for the user to interpret this data visually:
- Trend Signaling: It can display specific arrows or markers to highlight exactly where the trend flipped from up to down (or vice versa).
- High/Low Sensitivity: Users can choose between a standard mode (based on closing prices) or a high-sensitivity mode (based on the highest and lowest prices of each candle), allowing for faster reactions to price spikes.
- Color Coding: It includes an optional visual mode that highlights the active trend, making it easier to distinguish between bullish and bearish phases at a glance.
Summary for the User
Essentially, this tool filters out "market noise" by ignoring minor fluctuations that don't break the established trend boundaries. By moving in steps, it highlights significant structural changes in price, providing a clearer roadmap of where the market is heading without the lagging smoothness of a standard moving average.
//+------------------------------------------------------------------+
//|                                                    StepMA_v6.mq4 |
//|                           Copyright © 2005, TrendLaboratory Ltd. |
//|                                       E-mail: igorad2004@list.ru |
//+------------------------------------------------------------------+
#property copyright "Copyright © 2005, TrendLaboratory Ltd."
#property link      "E-mail: igorad2004@list.ru"

#property indicator_chart_window
#property indicator_buffers 3
#property indicator_color1 LightBlue
#property indicator_color2 Blue
#property indicator_color3 Red
//---- input parameters
extern int     Length=10;      // ATR Length
extern double  Kv=1.0;         // Sensivity Factor
extern int     StepSize=0;     // Constant Step Size (if need)
extern int     Advance=0;      // Offset
extern double  Percentage=0;
extern bool    HighLow=false;  // High/Low Mode Switch (more sensitive)
extern bool    Color=false;    // Color Mode Switch
extern int     BarsNumber=0;
//---- indicator buffers
double LineBuffer[];
double UpBuffer[];
double DnBuffer[];
double smin[];
double smax[];
//+------------------------------------------------------------------+
//| Custom indicator initialization function                         |
//+------------------------------------------------------------------+
  int init()
  {
   string short_name;
//---- indicator line
   IndicatorBuffers(5);
   SetIndexStyle(0,DRAW_LINE,STYLE_SOLID,1);
   SetIndexStyle(1,DRAW_ARROW);
   SetIndexStyle(2,DRAW_ARROW);
   SetIndexArrow(1,159);
   SetIndexArrow(2,159);
   SetIndexShift(0,Advance);
   SetIndexShift(1,Advance);
   SetIndexShift(2,Advance);
   SetIndexBuffer(0,LineBuffer);
   SetIndexBuffer(1,UpBuffer);
   SetIndexBuffer(2,DnBuffer);
   SetIndexBuffer(3,smin);
   SetIndexBuffer(4,smax);

   IndicatorDigits(MarketInfo(Symbol(),MODE_DIGITS));
//---- name for DataWindow and indicator subwindow label
   short_name="StepMA("+StepSize+","+Kv+","+StepSize+")";
   IndicatorShortName(short_name);
   SetIndexLabel(0,short_name);
   SetIndexLabel(1,"UpTrend");
   SetIndexLabel(2,"DownTrend");
//----
   SetIndexEmptyValue(0,0.0);
   SetIndexEmptyValue(1,0.0);
   SetIndexEmptyValue(2,0.0);

   SetIndexDrawBegin(0,Length);
   SetIndexDrawBegin(1,Length);
   SetIndexDrawBegin(2,Length);
//----
   return(0);
  }

//+------------------------------------------------------------------+
//| StepMA_v6                                                         |
//+------------------------------------------------------------------+
int start()
  {
   int i,shift,trend,Step;
   double smin0,smax0,smin1,smax1,ATRmin=1000000,ATRmax=-1000000,AvgRange,ATR0;

	if(BarsNumber>0) int Nbars=BarsNumber; else Nbars=Bars;

   for(shift=Nbars-1-Length;shift>=0;shift--)
   {

   if( StepSize==0 )
   {
        AvgRange=0;
	     for (i=Length-1;i>=0;i--)
	     {
            AvgRange+= (High[shift+i]-Low[shift+i]);
        }
	     ATR0 = AvgRange/Length;

	if (ATR0>ATRmax) ATRmax=ATR0;
	if (ATR0<ATRmin) ATRmin=ATR0;

	Step=0.5*Kv*(ATRmax+ATRmin)/Point;
	}
	else
	{Step=Kv*StepSize;}

	Comment (" StepSize= ", Step);
	if (HighLow)
	  {
	  smax[shift]=Low[shift]+2.0*Step*Point;
	  smin[shift]=High[shift]-2.0*Step*Point;
     }
	else
	  {
	  smax[shift]=Close[shift]+2.0*Step*Point;
	  smin[shift]=Close[shift]-2.0*Step*Point;
	  }

	  if (Close[shift]>smax[shift+1])  trend=1;
	  if (Close[shift]<smin[shift+1])  trend=-1;

	  if(trend>0)
	  {
	  if(smin[shift]<smin[shift+1]) smin[shift]=smin[shift+1];
	  double Line=smin[shift]+Step*Point;
	  if(Color) {UpBuffer[shift]=smin[shift];DnBuffer[shift]=-1.0;}
	  }
	  else
	  {
	  if(smax[shift]>smax[shift+1]) smax[shift]=smax[shift+1];
	  Line=smax[shift]-Step*Point;
	  if(Color) {DnBuffer[shift]=smax[shift];UpBuffer[shift]=-1.0;}
	  }
	  LineBuffer[shift]=Line+Percentage/100.0*Step*Point;
	 }
	return(0);
 }
Comments