SilverTrend_SignalWith Alert_v1
Download script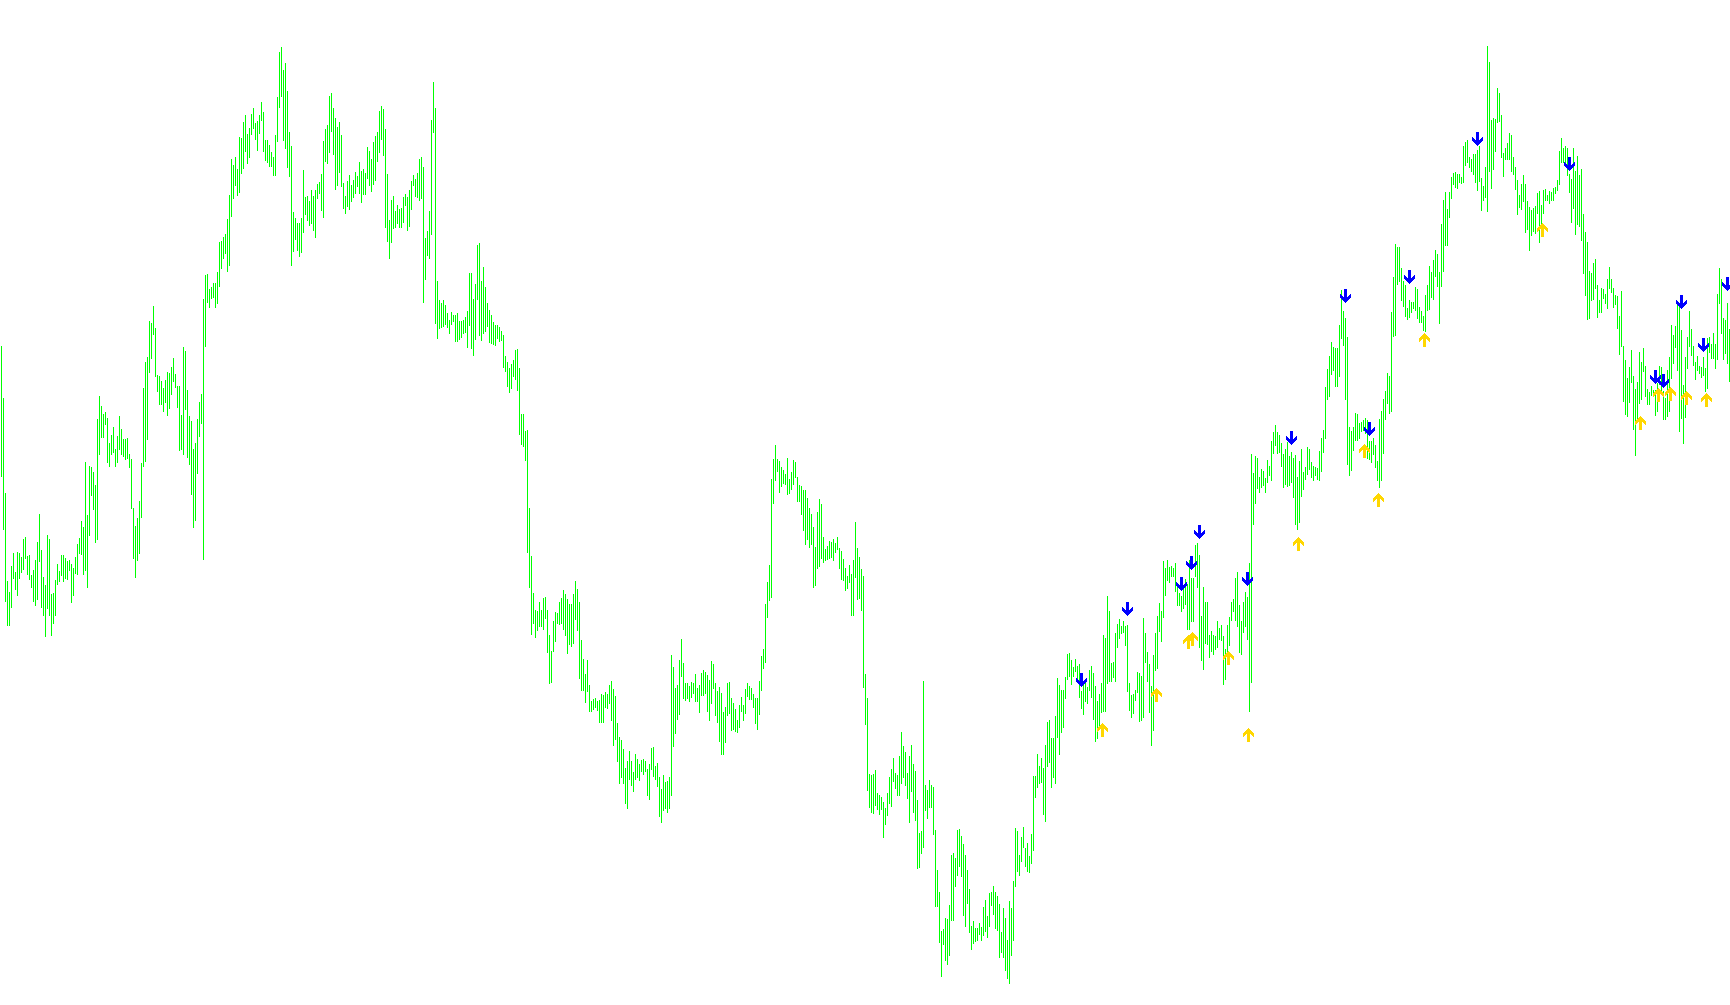
The SilverTrend_Signal tool is designed to identify and visualize trend shifts in the financial markets by analyzing price action over a specific look-back period. It functions as a dynamic breakout indicator that monitors how prices move relative to recent highs and lows to determine when a new direction (Buy or Sell) is likely forming.
How the Logic Works
1. Market Scanning and Range Analysis The script constantly looks back at a set number of historical bars (defined by the user). For every point on the chart, it calculates the "Average Range"—this is essentially measuring the typical volatility of price movement over that timeframe. By knowing the average size of price candles, the tool can better understand what constitutes a significant move versus standard market noise.
2. Identifying Key Boundaries The core of the logic involves identifying the highest high and the lowest low reached within the recent look-back period. Based on these extremes, the script calculates two dynamic "threshold" levels:
- A Lower Boundary: Used to confirm downward pressure.
- An Upper Boundary: Used to confirm upward momentum.
The distance of these boundaries from the absolute highs and lows is determined by a "Risk" factor. This allows the tool to ignore minor fluctuations and only react when price breaks through significant structural levels.
3. Trend Detection (Buy vs. Sell Signals) The script determines the trend status based on where the current closing price sits in relation to those boundaries:
- Bullish Shift: If the closing price breaks above the upper threshold, the system identifies an "uptrend."
- Bearish Shift: If the closing price drops below the lower threshold, the system identifies a "downtrend."
4. Signal Execution The tool is designed to only provide a signal at the exact moment the trend changes (e.g., when the status flips from "down" to "up").
- When a Buy Signal occurs, it places an Aqua-colored arrow below the price candle.
- When a Sell Signal occurs, it places a Violet-colored arrow above the price candle.
To ensure these signals are useful for trading, the script positions the arrows based on the average range calculated earlier. This ensures that the icons appear at a visually consistent distance from the price bars, preventing them from cluttering the actual candles while remaining clearly visible to the user.
//+------------------------------------------------------------------+
//| SilverTrend_Signal.mq4
//| Ramdass - Conversion only
//+------------------------------------------------------------------+
#property copyright "SilverTrend  rewritten by CrazyChart"
#property link      "http://viac.ru/"

#property indicator_chart_window
#property indicator_buffers 2
#property indicator_color1 Aqua
#property indicator_color2 Violet

//---- input parameters
extern int RISK=3;
extern int CountBars=350;
extern int NumberofAlerts=2;
int SSP=9;
int counter=0;
//---- buffers
double val1[];
double val2[];

//+------------------------------------------------------------------+
//| Custom indicator initialization function                         |
//+------------------------------------------------------------------+
int init()
  {
   string short_name;
//---- indicator line
   IndicatorBuffers(2);
   SetIndexStyle(0,DRAW_ARROW);
   SetIndexArrow(0,233);
   SetIndexStyle(1,DRAW_ARROW);
   SetIndexArrow(1,234);
   SetIndexBuffer(0,val1);
   SetIndexBuffer(1,val2);
//----
   return(0);
  }
//+------------------------------------------------------------------+
//| SilverTrend_Signal                                               |
//+------------------------------------------------------------------+
int start()
  {
   if (CountBars>=Bars) CountBars=Bars;
   SetIndexDrawBegin(0,Bars-CountBars+SSP);
   SetIndexDrawBegin(1,Bars-CountBars+SSP);
   int i,shift,counted_bars=IndicatorCounted();
   int i1,i2,K;
   double Range,AvgRange,smin,smax,SsMax,SsMin,price;
   bool uptrend,old;
//----

   if(Bars<=SSP+1) return(0);
//---- initial zero
   if(counted_bars<SSP+1)
   {
      for(i=1;i<=SSP;i++) val1[CountBars-i]=0.0;
      for(i=1;i<=SSP;i++) val2[CountBars-i]=0.0;
   }
//----

K=33-RISK;
for (shift = CountBars-SSP; shift>=0; shift--)
{

	Range=0;
	AvgRange=0;
	for (i1=shift; i1<=shift+SSP; i1++)
		{AvgRange=AvgRange+MathAbs(High[i1]-Low[i1]);
		}
	Range=AvgRange/(SSP+1);

SsMax=High[shift]; SsMin=Low[shift];
   for (i2=shift;i2<=shift+SSP-1;i2++)
        {
         price=High[i2];
         if(SsMax<price) SsMax=price;
         price=Low[i2];
         if(SsMin>=price)  SsMin=price;
        }

smin = SsMin+(SsMax-SsMin)*K/100;
smax = SsMax-(SsMax-SsMin)*K/100;
	val1[shift]=0;
	val2[shift]=0;
	if (Close[shift]<smin)
		{
		uptrend = false;
		}
	if (Close[shift]>smax)
		{
		uptrend = true;
		}
   if (uptrend!=old && uptrend==true)
   {
   val1[shift]=Low[shift]-Range*0.5;
   counter=0;
   if (shift==0 && counter<=NumberofAlerts)
   {
   //Alert("Silver Trend ",Period()," ",Symbol()," BUY");
   counter=counter+1;
   }
   }
   if (uptrend!=old && uptrend==false)
   {
   counter=0;
   val2[shift]=High[shift]+Range*0.5;
   if (shift==0 && counter<=NumberofAlerts)
   {
   //Alert("Silver Trend ",Period()," ",Symbol()," SELL");
   counter=counter+1;

   }
   }
   Comment(shift);
   old=uptrend;

}
   return(0);
  }
//+------------------------------------------------------------------+
Comments