SilverTrend_Signal With Alert v2_v1
Download script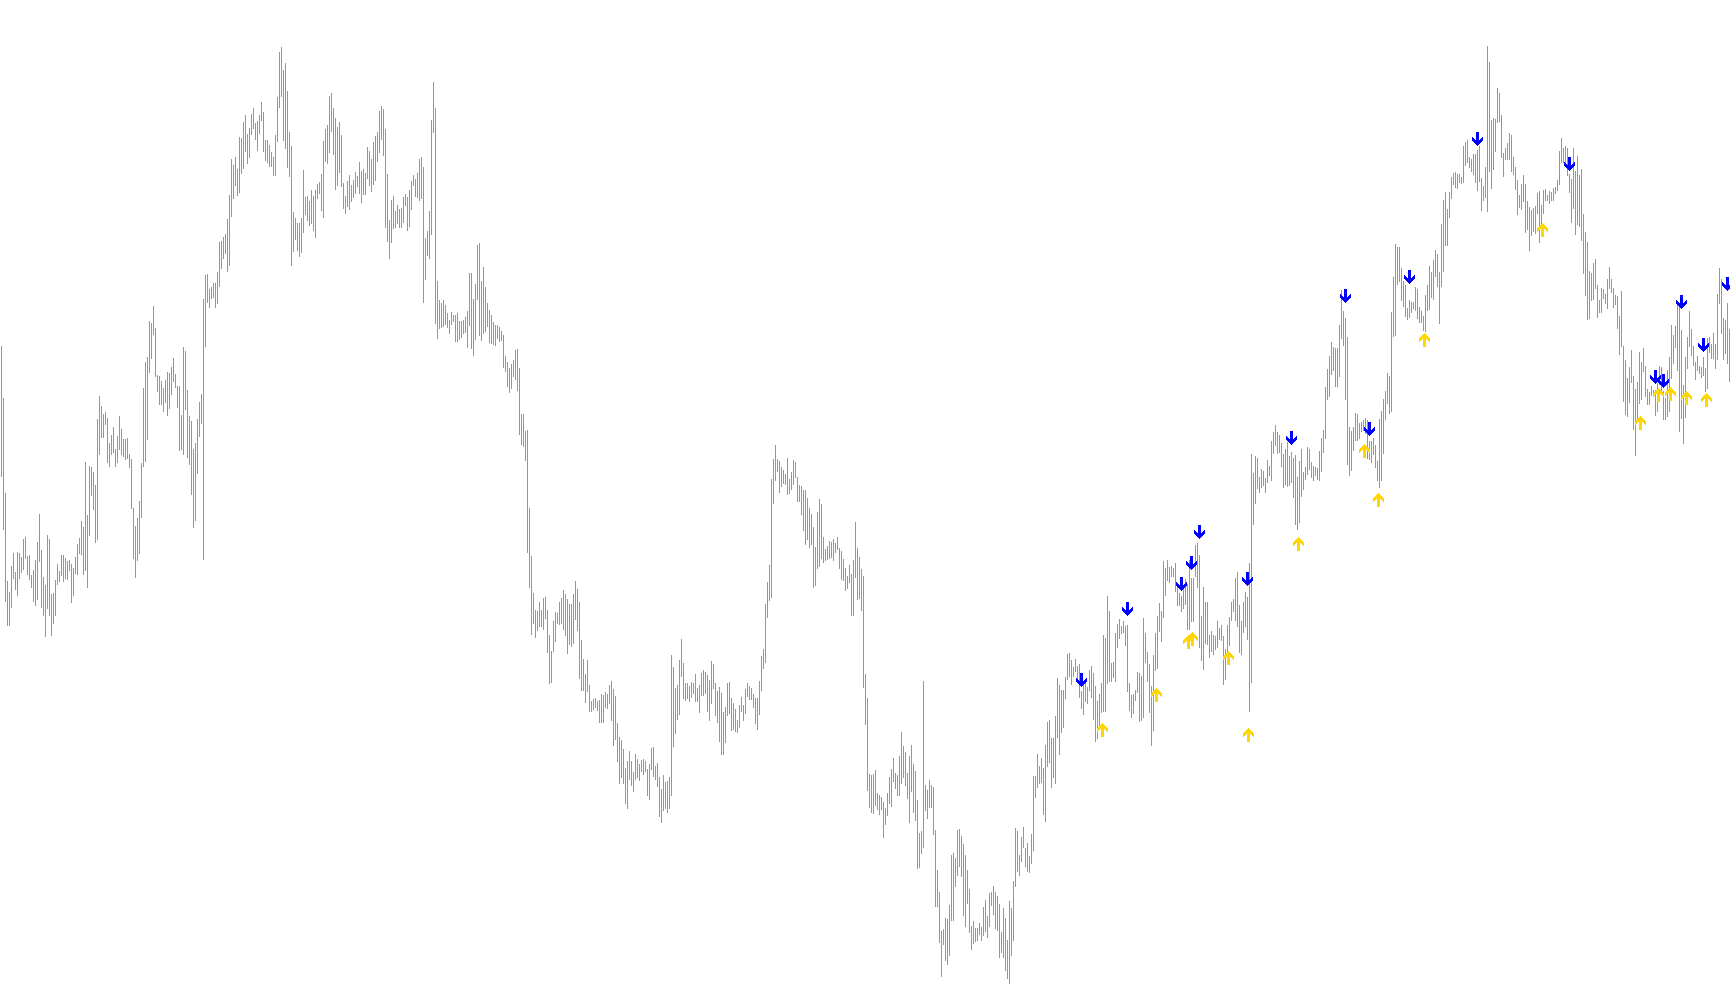
The SilverTrend Signal is a market analysis tool designed to identify potential trend reversals by monitoring price action and volatility. Instead of just looking at where the price is currently, it evaluates the relationship between recent price highs and lows over a specific window of time to determine if the market is shifting momentum.
Core Logic and Mechanics
1. Volatility Measurement The script first calculates the average "range" of the market—the typical distance between the highest and lowest prices reached during each bar over a set period. This allows the tool to understand how much the asset normally fluctuates, which helps it determine where a significant price move actually occurs versus just normal "noise."
2. Dynamic Boundary Calculation The tool identifies the highest high and the lowest low within its looking window. It then creates two dynamic boundaries based on these extremes:
- A Lower Boundary is established above the recent low.
- An Upper Boundary is established below the recent high.
The gap between these boundaries is determined by a user-defined risk factor. This means that for a trend to be considered "broken," the price must push significantly into these zones, ensuring that small, insignificant fluctuations don't trigger false signals.
3. Trend Detection and State Switching The script continuously monitors the closing price of the current bar against these boundaries:
- Bullish Shift: If the price closes above the upper boundary, the tool identifies a transition into an upward trend.
- Bearish Shift: If the price closes below the lower boundary, it identifies a transition into a downward trend.
By tracking whether the "trend state" has changed compared to the previous bar, the script filters out continuous movement and only focuses on the exact moment the momentum flips.
Visual Signals and Alerts
When a definitive shift in momentum is detected, the script performs three actions:
- Visual Markers: It places specific symbols (arrows) on the chart at the point of reversal. The position of these arrows is offset slightly from the high or low of the candle using the volatility data gathered earlier, ensuring they are clearly visible and do not overlap with the price bars.
- Real-Time Notifications: If a trend change occurs on the most recent live bar, the script triggers a pop-up alert on your screen, specifying whether it is a "BUY" or "SELL" signal based on the detected direction.
- Alert Limitation: To prevent repetitive notifications during a single trend movement, the system includes a counter to manage how many alerts are sent, ensuring you aren't overwhelmed by multiple pings for the same price action.
//+------------------------------------------------------------------+
//| SilverTrend_Signal.mq4
//| Ramdass - Conversion only
//+------------------------------------------------------------------+
#property copyright "SilverTrend  rewritten by CrazyChart"
#property link      "http://viac.ru/"

#property indicator_chart_window
#property indicator_buffers 2
#property indicator_color1 DodgerBlue
#property indicator_color2 Magenta

//---- input parameters
extern int RISK=3;
extern int CountBars=350;
extern int NumberofAlerts=2;
int SSP=9;
int counter=0;
//---- buffers
double val1[];
double val2[];

//+------------------------------------------------------------------+
//| Custom indicator initialization function                         |
//+------------------------------------------------------------------+
int init()
  {
   string short_name;
//---- indicator line
   IndicatorBuffers(2);
   SetIndexStyle(0,DRAW_ARROW);
   SetIndexArrow(0,233);
   SetIndexStyle(1,DRAW_ARROW);
   SetIndexArrow(1,234);
   SetIndexBuffer(0,val1);
   SetIndexBuffer(1,val2);
//----
   return(0);
  }
//+------------------------------------------------------------------+
//| SilverTrend_Signal                                               |
//+------------------------------------------------------------------+
int start()
  {
   if (CountBars>=Bars) CountBars=Bars;
   SetIndexDrawBegin(0,Bars-CountBars+SSP);
   SetIndexDrawBegin(1,Bars-CountBars+SSP);
   int i,shift,counted_bars=IndicatorCounted();
   int i1,i2,K;
   double Range,AvgRange,smin,smax,SsMax,SsMin,price;
   bool uptrend,old;
//----

   if(Bars<=SSP+1) return(0);
//---- initial zero
   if(counted_bars<SSP+1)
   {
      for(i=1;i<=SSP;i++) val1[CountBars-i]=0.0;
      for(i=1;i<=SSP;i++) val2[CountBars-i]=0.0;
   }
//----

K=33-RISK;
for (shift = CountBars-SSP; shift>=0; shift--)
{

	Range=0;
	AvgRange=0;
	for (i1=shift; i1<=shift+SSP; i1++)
		{AvgRange=AvgRange+MathAbs(High[i1]-Low[i1]);
		}
	Range=AvgRange/(SSP+1);

SsMax=High[shift]; SsMin=Low[shift];
   for (i2=shift;i2<=shift+SSP-1;i2++)
        {
         price=High[i2];
         if(SsMax<price) SsMax=price;
         price=Low[i2];
         if(SsMin>=price)  SsMin=price;
        }

smin = SsMin+(SsMax-SsMin)*K/100;
smax = SsMax-(SsMax-SsMin)*K/100;
	val1[shift]=0;
	val2[shift]=0;
	if (Close[shift]<smin)
		{
		uptrend = false;
		}
	if (Close[shift]>smax)
		{
		uptrend = true;
		}
   if (uptrend!=old && uptrend==true)
   {
   val1[shift]=Low[shift]-Range*0.5;
   counter=0;
   if (shift==0 && counter<=NumberofAlerts)
   {
   Alert("Silver Trend ",Period()," ",Symbol()," BUY");
   counter=counter+1;
   }
   }
   if (uptrend!=old && uptrend==false)
   {
   counter=0;
   val2[shift]=High[shift]+Range*0.5;
   if (shift==0 && counter<=NumberofAlerts)
   {
   Alert("Silver Trend ",Period()," ",Symbol()," SELL");
   counter=counter+1;

   }
   }
   Comment(shift);
   old=uptrend;

}
   return(0);
  }
//+------------------------------------------------------------------+
Comments