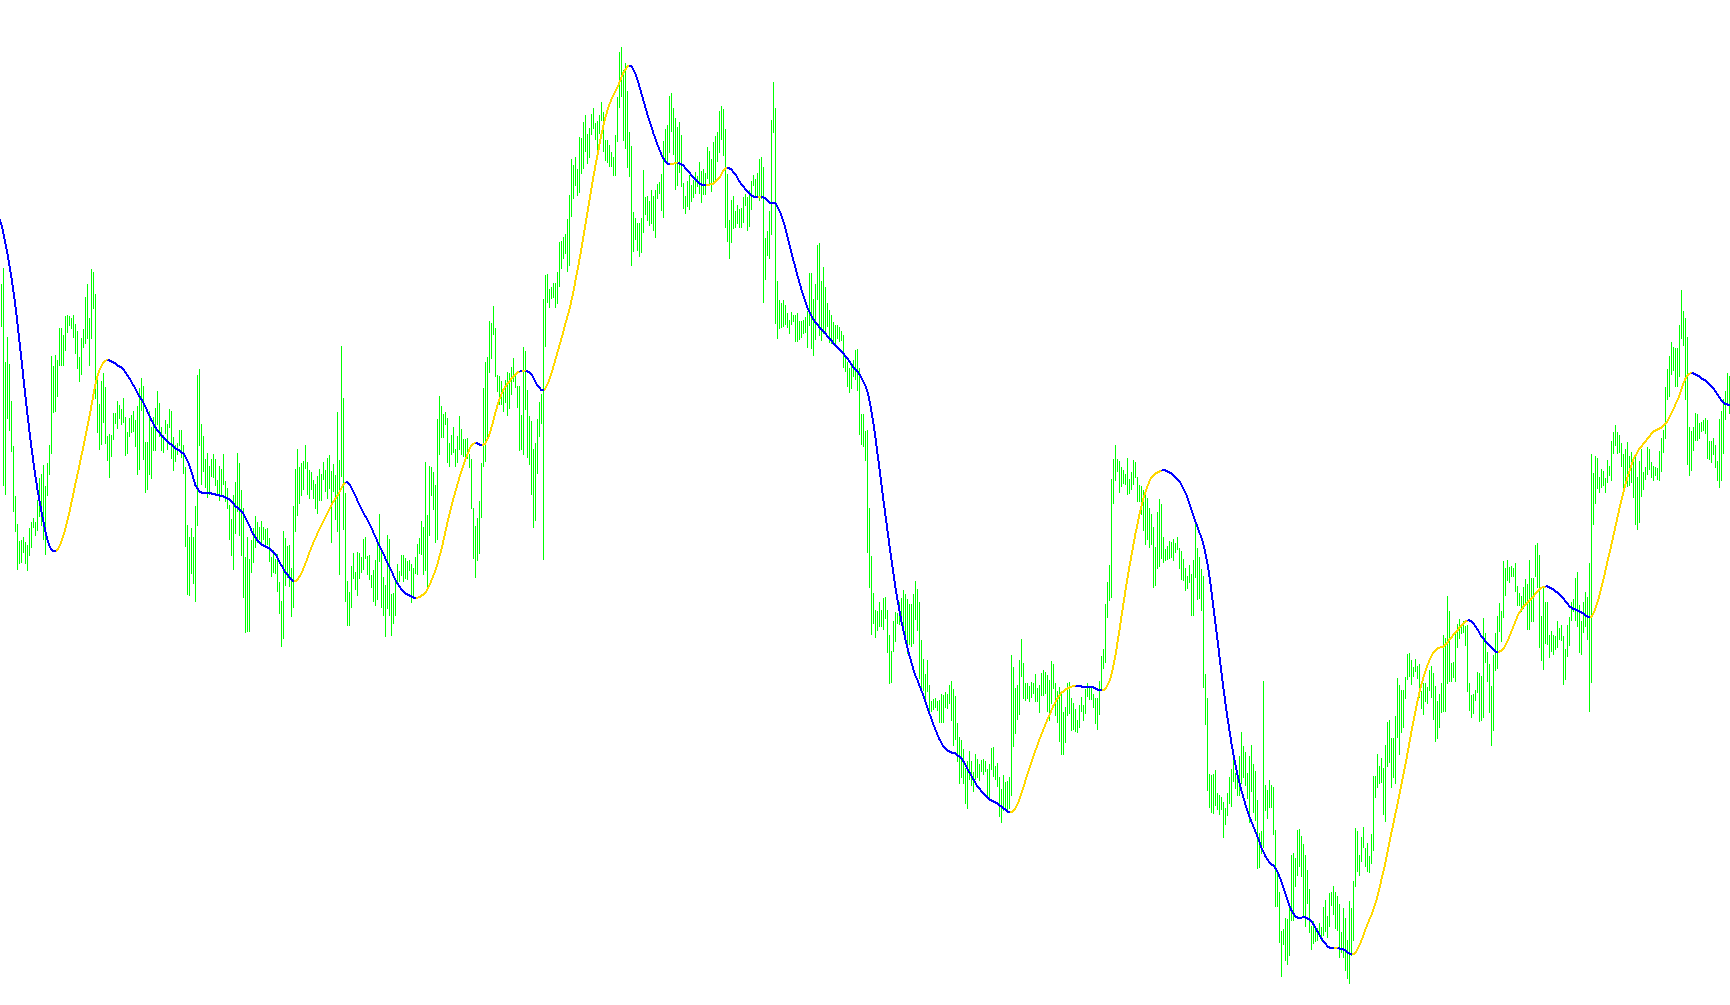
This tool is designed to help traders visualize and identify the underlying direction of a market trend by smoothing out price fluctuations. Rather than looking at raw, volatile price movements, the script processes data through several layers of calculation to highlight the "slope" or general momentum of the market.
How the Logic Works
1. Data Smoothing (Weighting) The script begins by taking historical price data and applying a weighted moving average. Unlike a simple average that treats all past prices equally, this method places more significance on recent price action. By doing this, the tool filters out "noise"—the small, insignificant ups and downs that can often distract from the primary market move.
2. Vector Calculation To determine momentum, the script performs a mathematical comparison between two different moving averages: one based on a standard period and another based on half of that period. By subtracting the larger average from the smaller one (and doubling the smaller one), the tool creates a "vector." This vector essentially measures the speed and strength with which the price is moving in a specific direction.
3. Trend Mapping Once these vectors are calculated, the script applies a second smoothing pass. This produces a refined map of the trend's slope. This step is crucial because it ensures that the line on your chart doesn't react too quickly to tiny price wobbles, providing a much cleaner and more reliable visual of the market's trajectory.
4. Visual Directional Tracking The final stage of the logic identifies whether the slope is currently moving up or down:
- Uptrend Identification: If the current slope value is higher than the previous one, the script classifies this as an upward trend. It then draws a specific line (colored Light Blue) on your chart to represent this growth phase.
- Downtrend Identification: If the slope value is lower than the previous one, the script classifies this as a downward trend and highlights it with a different color (Tomato).
Key Takeaway for the User
The primary goal of this script is trend clarity. Instead of making you guess which way the market is heading based on messy candles, it calculates the "velocity" of the price movement. It provides a clear visual distinction between periods of growth and periods of decline, allowing you to see the "big picture" of the market's direction more easily.
//+------------------------------------------------------------------+
//| HMA.mq4
//| Copyright © 2006 WizardSerg <wizardserg@mail.ru>, ?? ??????? ForexMagazine #104
//| wizardserg@mail.ru
//| Revised by IgorAD,igorad2003@yahoo.co.uk |
//| Personalized by iGoR AKA FXiGoR for the Trend Slope Trading method (T_S_T)
//| Link:
//| contact: thefuturemaster@hotmail.com
//+------------------------------------------------------------------+
#property copyright "MT4 release WizardSerg <wizardserg@mail.ru>, ?? ??????? ForexMagazine #104"
#property link      "wizardserg@mail.ru"

#property indicator_chart_window
#property indicator_buffers 2
#property indicator_color1 LightBlue
#property indicator_color2 Tomato
//---- input parameters
extern int       period=80;
extern int       method=3;                         // MODE_SMA
extern int       price=0;                          // PRICE_CLOSE
//---- buffers
double Uptrend[];
double Dntrend[];
double ExtMapBuffer[];


//+------------------------------------------------------------------+
//| Custom indicator initialization function                         |
//+------------------------------------------------------------------+
int init()
{
    IndicatorBuffers(3);
    SetIndexBuffer(0, Uptrend);
    //ArraySetAsSeries(Uptrend, true);
    SetIndexBuffer(1, Dntrend);
    //ArraySetAsSeries(Dntrend, true);
    SetIndexBuffer(2, ExtMapBuffer);
    ArraySetAsSeries(ExtMapBuffer, true);

    SetIndexStyle(0,DRAW_LINE,STYLE_SOLID,2);
    SetIndexStyle(1,DRAW_LINE,STYLE_SOLID,2);

    IndicatorShortName("Slope Direction Line("+period+")");
    return(0);
}

//+------------------------------------------------------------------+
//| Custor indicator deinitialization function                       |
//+------------------------------------------------------------------+
int deinit()
{
    // ???? ????? ?????? ??????
    return(0);
}

//+------------------------------------------------------------------+
//| ?????????? ???????                                               |
//+------------------------------------------------------------------+
double WMA(int x, int p)
{
    return(iMA(NULL, 0, p, 0, method, price, x));
}

//+------------------------------------------------------------------+
//| Custom indicator iteration function                              |
//+------------------------------------------------------------------+
int start()
{


    int counted_bars = IndicatorCounted();

    if(counted_bars < 0)
        return(-1);

    int x = 0;
    int p = MathSqrt(period);
    int e = Bars - counted_bars + period + 1;

    double vect[], trend[];

    if(e > Bars)
        e = Bars;

    ArrayResize(vect, e);
    ArraySetAsSeries(vect, true);
    ArrayResize(trend, e);
    ArraySetAsSeries(trend, true);

    for(x = 0; x < e; x++)
    {
        vect[x] = 2*WMA(x, period/2) - WMA(x, period);
 //       Print("Bar date/time: ", TimeToStr(Time[x]), " close: ", Close[x], " vect[", x, "] = ", vect[x], " 2*WMA(p/2) = ", 2*WMA(x, period/2), " WMA(p) = ",  WMA(x, period));
    }

    for(x = 0; x < e-period; x++)

        ExtMapBuffer[x] = iMAOnArray(vect, 0, p, 0, method, x);

    for(x = e-period; x >= 0; x--)
    {
        trend[x] = trend[x+1];
        if (ExtMapBuffer[x]> ExtMapBuffer[x+1]) trend[x] =1;
        if (ExtMapBuffer[x]< ExtMapBuffer[x+1]) trend[x] =-1;

    if (trend[x]>0)
    { Uptrend[x] = ExtMapBuffer[x];
      if (trend[x+1]<0) Uptrend[x+1]=ExtMapBuffer[x+1];
      Dntrend[x] = EMPTY_VALUE;
    }
    else
    if (trend[x]<0)
    {
      Dntrend[x] = ExtMapBuffer[x];
      if (trend[x+1]>0) Dntrend[x+1]=ExtMapBuffer[x+1];
      Uptrend[x] = EMPTY_VALUE;
    }

    //Print( " trend=",trend[x]);
    }

    return(0);
}
//+------------------------------------------------------------------+
Comments