MA_MTF_MovingAverage_v1.1_HrzLn
Download script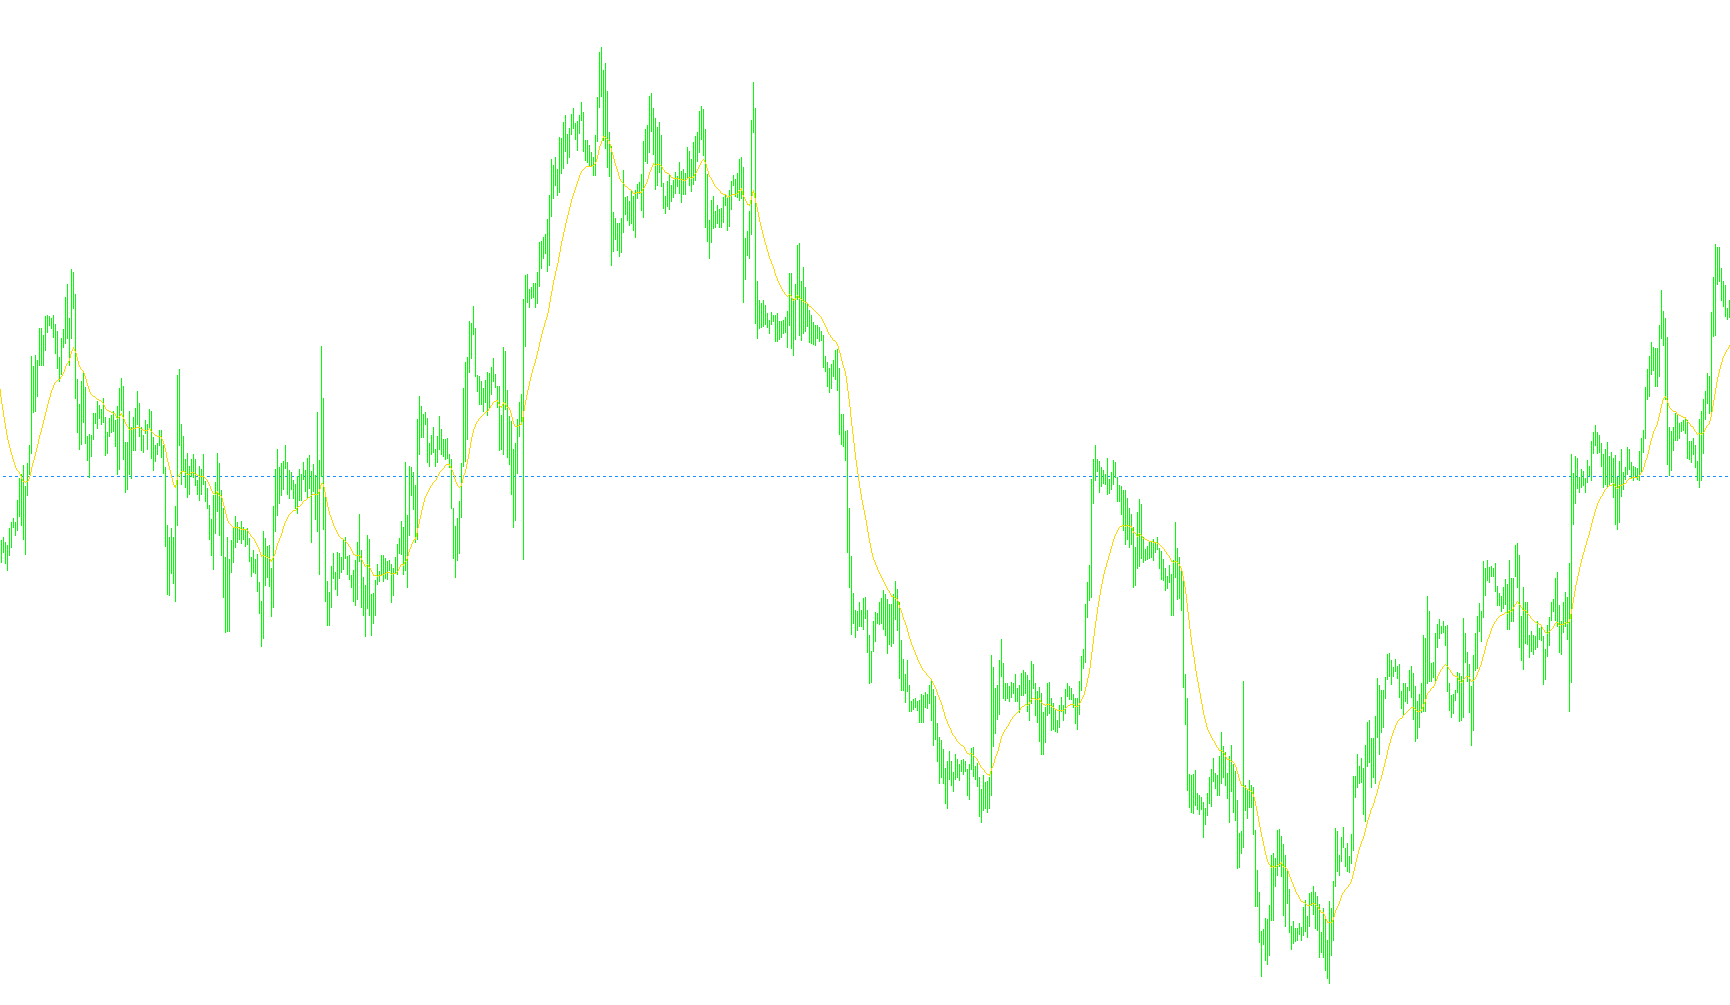
This script is a specialized technical analysis tool designed for the MetaTrader platform. Its primary purpose is to allow traders to visualize moving averages from higher timeframes directly onto their current lower timeframe chart.
Core Functionality
In standard trading, most indicators are locked to the timeframe you are currently viewing (e.g., if you are looking at a 1-minute chart, the moving average only calculates based on 1-minute data). This script breaks that limitation by "fetching" data from different periods—such as Daily, Weekly, or Hourly—and projecting it onto your active screen.
Key Features and Logic
Multi-Timeframe Integration The script can pull moving average data from a wide variety of intervals (ranging from 1 minute up to monthly data). It automatically calculates the mathematical difference between your current view and the target timeframe to ensure the data aligns correctly with the price action on your screen.
Customizable Moving Average Types Users are not limited to a single type of calculation. The logic supports four distinct standard moving average methodologies:
- Simple Moving Average (SMA)
- Exponential Moving Average (EMA)
- Smoothed Moving Average (SMMA)
- Linear Weighted Moving Average (LWMA)
Price Source Selection The script allows for flexibility in which price point is used to calculate the average. It can be configured to look at the Close price, Open price, Highs, Lows, or various mathematical medians (such as a weighted average of the high, low, and close).
Visual Layout and Customization Beyond the primary moving average line, the script includes several visual management features:
- Dynamic Labeling: It automatically updates its name on the chart to clearly display which timeframe and calculation method is being shown.
- Horizontal Reference Line: It includes an option to draw a horizontal "level" line. This helps traders identify specific price thresholds or support/resistance levels based on the moving average value at a specific bar.
- Visual Styling: Users can customize the color, thickness, and style (solid, dashed, etc.) of both the moving average and the horizontal reference line to suit their personal charting preferences.
Summary for the User
Essentially, this tool acts as a "bridge." It allows you to keep your eyes on a fast-moving chart (like a 5-minute chart) while simultaneously keeping track of the broader trend happening on a much larger scale (like a 4-hour or Daily chart) without having to constantly switch back and forth between different windows.
//+------------------------------------------------------------------+
//|                                            MTF_MovingAverage.mq4 |
//|                                      Copyright © 2006, Keris2112 |
//|                                                                  |
//+------------------------------------------------------------------+
#property copyright "Copyright © 2006, Keris2112"
#property link      "http://www.forex-tsd.com"

#property indicator_chart_window
#property indicator_buffers 1
#property indicator_color1 Blue
#property indicator_width1 2

//---- input parameters
/*************************************************************************
PERIOD_M1   1
PERIOD_M5   5
PERIOD_M15  15
PERIOD_M30  30
PERIOD_H1   60
PERIOD_H4   240
PERIOD_D1   1440
PERIOD_W1   10080
PERIOD_MN1  43200
You must use the numeric value of the timeframe that you want to use
when you set the TimeFrame' value with the indicator inputs.
---------------------------------------
PRICE_CLOSE    0 Close price.
PRICE_OPEN     1 Open price.
PRICE_HIGH     2 High price.
PRICE_LOW      3 Low price.
PRICE_MEDIAN   4 Median price, (high+low)/2.
PRICE_TYPICAL  5 Typical price, (high+low+close)/3.
PRICE_WEIGHTED 6 Weighted close price, (high+low+close+close)/4.
You must use the numeric value of the Applied Price that you want to use
when you set the 'applied_price' value with the indicator inputs.
---------------------------------------
MODE_SMA    0 Simple moving average,
MODE_EMA    1 Exponential moving average,
MODE_SMMA   2 Smoothed moving average,
MODE_LWMA   3 Linear weighted moving average.
You must use the numeric value of the MA Method that you want to use
when you set the 'ma_method' value with the indicator inputs.

**************************************************************************/
extern int TimeFrame=0;
extern int MAPeriod=21;
extern int ma_shift=0;
extern int ma_method=1;
extern int applied_price=0;

extern bool    DrawMALine=true;
extern bool    DrawHrzLine=true;
extern color   HrzLineColor=DodgerBlue;
extern int     HrzLineStyle=2;
extern int     HrzLineWidth=1;
extern int     HrzLineOnBar=0;
extern bool    HrzLineOnBackground=true;

extern string   note_Price = "0C 1O 2H 3L 4Md 5Tp 6WghC: Md(HL/2)4,Tp(HLC/3)5,Wgh(HLCC/4)6";
extern string   _MA_Method = "SMA0 EMA1 SMMA2 LWMA3";
extern string TimeFrames = "M1;5,15,30,60H1;240H4;1440D1;10080W1;43200MN";

string short_name;
string HrzLine1;


double ExtMapBuffer1[];
//+------------------------------------------------------------------+
//| Custom indicator initialization function                         |
//+------------------------------------------------------------------+
int init()
  {
//   string short_name;
//---- indicator line
   SetIndexBuffer(0,ExtMapBuffer1);

   if (DrawMALine)
   SetIndexStyle(0,DRAW_LINE);
   else
   SetIndexStyle(0,DRAW_NONE);

   if(TimeFrame==0) TimeFrame = Period();
   SetIndexShift(0,ma_shift*TimeFrame/Period());
//---- name for DataWindow and indicator subwindow label
   switch(ma_method)
     {
      case 1 : short_name="MTF_EMA("; break;
      case 2 : short_name="MTF_SMMA("; break;
      case 3 : short_name="MTF_LWMA("; break;
      default : short_name="MTF_SMA(";
     }
   switch(TimeFrame)
   {
      case 1 : string TimeFrameStr="M1"; break;
      case 5 : TimeFrameStr="M5"; break;
      case 15 : TimeFrameStr="M15"; break;
      case 30 : TimeFrameStr="M30"; break;
      case 60 : TimeFrameStr="H1"; break;
      case 240 : TimeFrameStr="H4"; break;
      case 1440 : TimeFrameStr="D1"; break;
      case 10080 : TimeFrameStr="W1"; break;
      case 43200 : TimeFrameStr="MN1"; break;
      default : TimeFrameStr="TF0";
   }

   IndicatorShortName(short_name +MAPeriod+") "+TimeFrameStr);
   HrzLine1= short_name+ MAPeriod+") "+TimeFrameStr;
   TimeFrame = MathMax(TimeFrame, Period());

  return(0);
  }

//----
  int deinit()
{

   ObjectDelete(HrzLine1);
   return(0);
}


//+------------------------------------------------------------------+
//| MTF Moving Average                                   |
//+------------------------------------------------------------------+
int start()
  {
   datetime TimeArray[];
   int    i,shift,limit,y,counted_bars=IndicatorCounted();

// Plot defined timeframe on to current timeframe
   ArrayCopySeries(TimeArray,MODE_TIME,Symbol(),TimeFrame);

   limit=Bars-counted_bars+TimeFrame/Period();
   //limit=Bars-counted_bars;  bad
   for(i=0,y=0;i<limit;i++)
   {
   if (Time[i]<iTime(NULL,TimeFrame,y)) y++;

 /***********************************************************
   Add your main indicator loop below.  You can reference an existing
      indicator with its iName  or iCustom.
   Rule 1:  Add extern inputs above for all neccesary values
   Rule 2:  Use 'TimeFrame' for the indicator timeframe
   Rule 3:  Use 'y' for the indicator's shift value
 **********************************************************/

   ExtMapBuffer1[i]=iMA(NULL,TimeFrame,MAPeriod,0,ma_method,applied_price,y) ;

   }

//


      if (ObjectFind(HrzLine1) != 0 && DrawHrzLine)
      ObjectCreate(HrzLine1,OBJ_HLINE,0,Time[0],ExtMapBuffer1[HrzLineOnBar]);
      ObjectSet(HrzLine1, OBJPROP_COLOR, HrzLineColor);
      ObjectSet(HrzLine1, OBJPROP_STYLE, HrzLineStyle);
      ObjectSet(HrzLine1, OBJPROP_WIDTH, HrzLineWidth);
      ObjectSet(HrzLine1, OBJPROP_BACK,  HrzLineOnBackground);


   return(0);
  }
//+------------------------------------------------------------------+
Comments