MA dots
Download script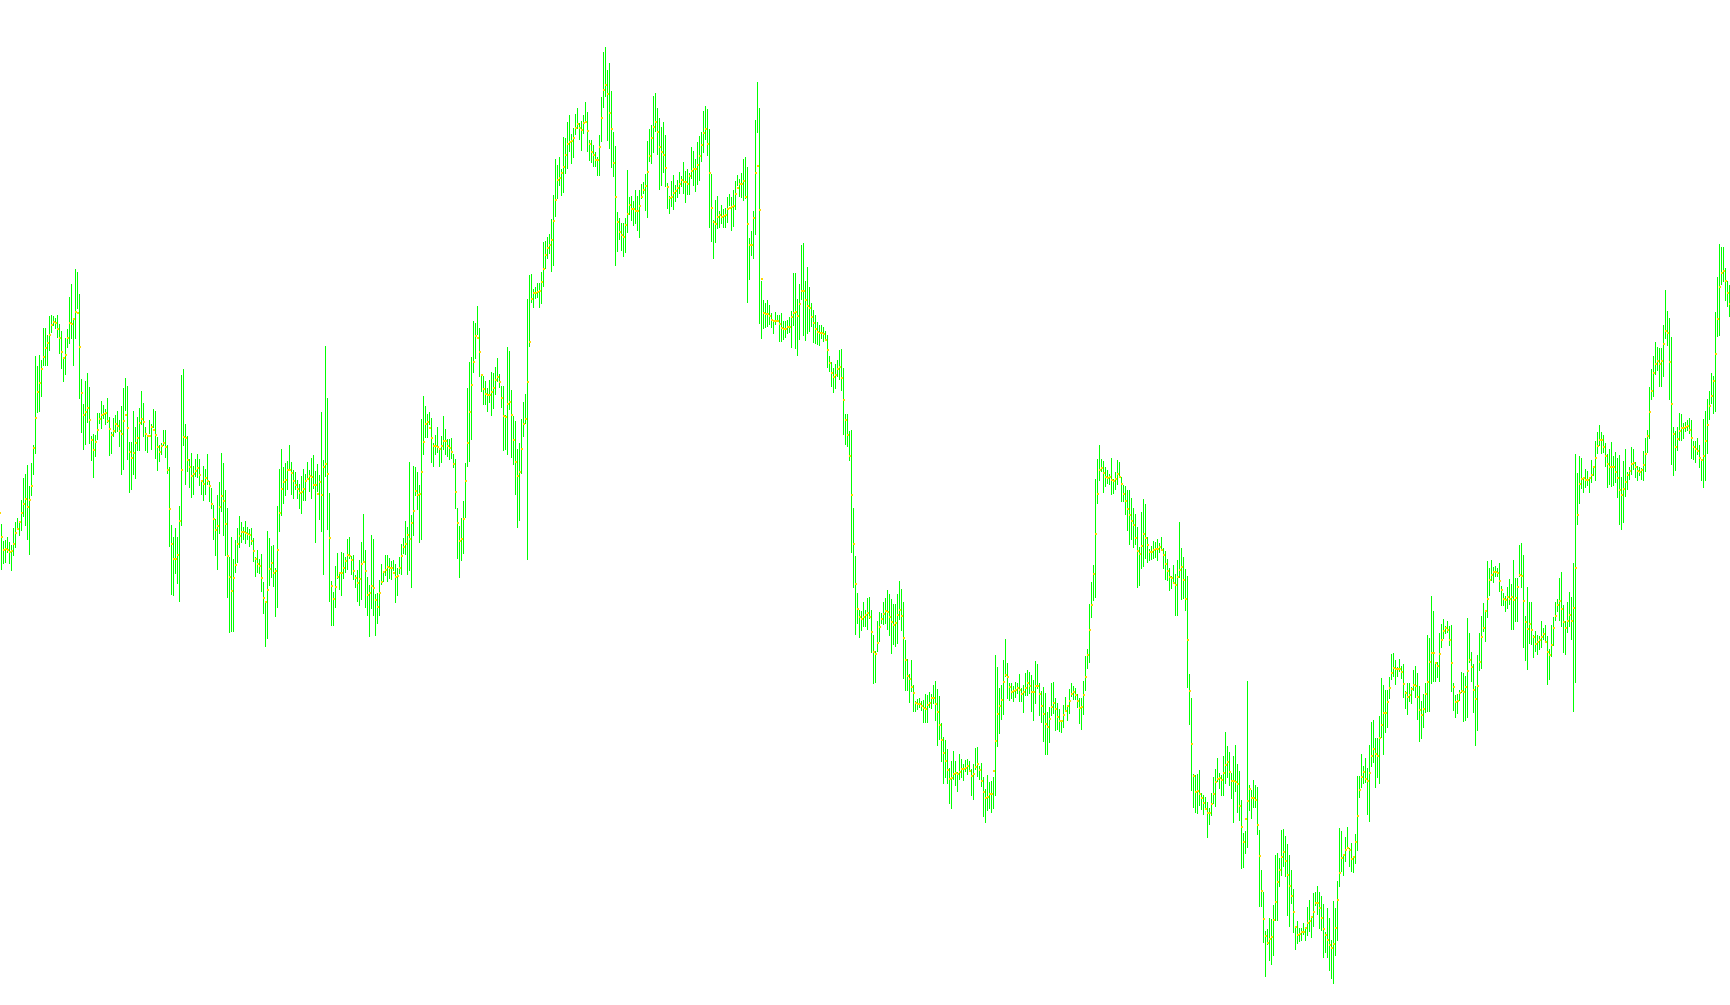
This script is a specialized visual tool designed to work in tandem with the ZoneJemputan(TM) system. Its primary purpose is to provide a simplified, clean visual representation of price trends by plotting specific data points directly on your trading chart.
Core Functionality
Instead of displaying a continuous, solid line that can sometimes clutter a workspace, this tool converts a Moving Average (MA) into a series of distinct dots. This allows traders to observe the underlying momentum and "flow" of the market while maintaining a minimalist aesthetic. By choosing to display data as dots rather than a solid line, it helps in identifying key price levels without over-complicating the visual information on the screen.
How the Logic Works
The script operates based on three main components:
- Trend Calculation: The tool looks at the "Median Price" (the midpoint between the high and low prices) of a specific timeframe. It then calculates a Simple Moving Average based on a user-defined length. This provides a smoothed average of recent price action, helping to filter out minor market noise.
- Customizable Sensitivity: A user-defined input allows you to set the "length" of the calculation. By adjusting this number, you can determine how quickly the dots react to new price movements—shorter lengths provide more immediate reactions, while longer lengths offer a broader view of the trend.
- Visual Placement: For every candle on your chart, the script calculates the required value and places a specific visual marker (a white dot) at that exact price point. This creates a trail of data points that follows the market's trajectory over time.
Summary for the User
In short, this tool is an aesthetic and functional overlay. It takes standard moving average data and transforms it into a "dotted" format. This allows you to see the current trend direction clearly, making it easier to align your entries with the ZoneJemputan(TM) system while keeping your charts organized and easy to read.
// To be used with the ZoneJemputan(TM)
#property copyright "MA plotted as dots"
#property link      "http://darmasdt.com/"

#property indicator_chart_window
#property indicator_buffers 1
#property indicator_color1 White

//---- input parameters
extern int panjang= 3;


//---- buffers
double titik[];

//---- variables

//+------------------------------------------------------------------+
//| Custom indicator initialization function                         |
//+------------------------------------------------------------------+
int init()
{
   //IndicatorDigits(MarketInfo(Symbol(),MODE_DIGITS)+1);
   //---- indicators
   SetIndexStyle(0,DRAW_ARROW);
   SetIndexArrow(0,158);
   SetIndexBuffer(0,titik);
   SetIndexEmptyValue(0,0.0);

   IndicatorShortName("Darma:: MA in DOT");


   return(0);
}
//+------------------------------------------------------------------+
//| Custor indicator deinitialization function                       |
//+------------------------------------------------------------------+
int deinit()
{
   //----

   //----
   return(0);
}
//+------------------------------------------------------------------+
//| Custom indicator iteration function                              |
//+------------------------------------------------------------------+
int start()
{
   int limit;

   //int signal = MathRound(signal_day*1440/Period());

   int counted_bars = IndicatorCounted();
   //---- check for possible errors
   if (counted_bars<0) return(-1);
   //---- last counted bar will be recounted
   if (counted_bars>0) counted_bars--;
   limit = Bars - counted_bars;

   for(int i=limit; i>=0; i--)
   {

      double bahan = iMA(NULL,0,panjang,0,MODE_SMA,PRICE_MEDIAN,i);
      titik[i]=bahan;

   }

   //----
   return(0);
}
//+------------------------------------------------------------------+
Comments