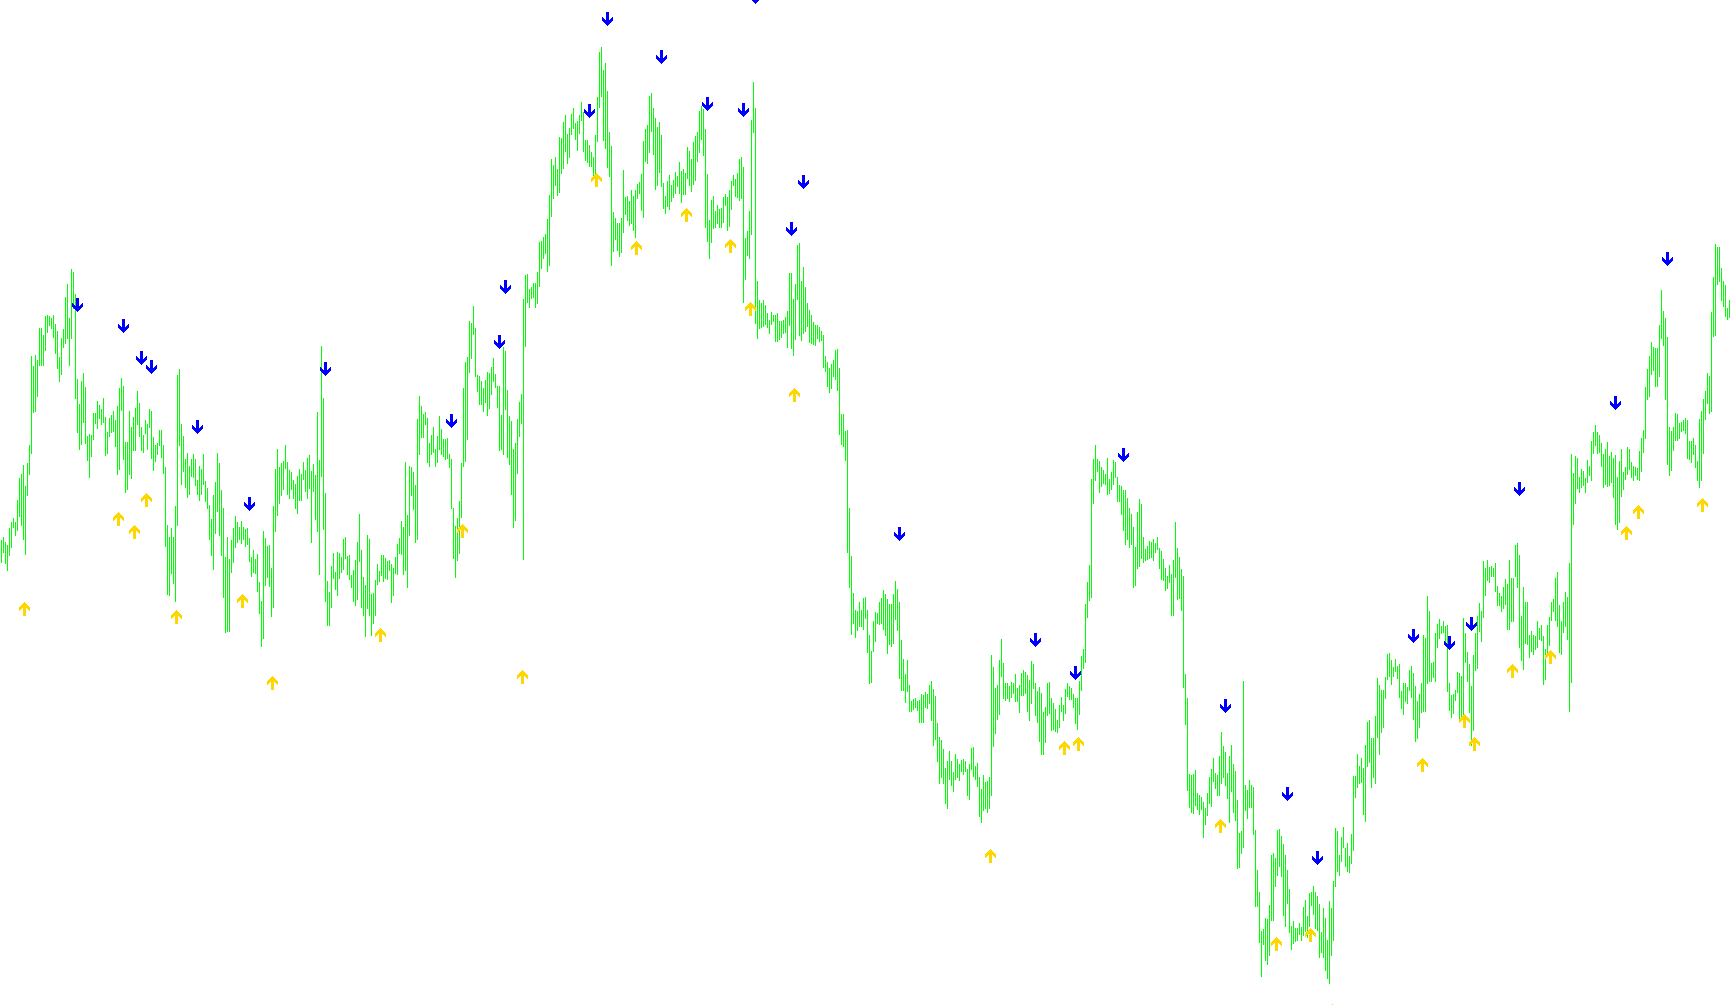
This script is designed as a visual aid for traders who use Moving Averages (MAs) to determine market trends. Its primary purpose is to identify and highlight the exact moment when two different moving averages cross paths, which is often used as a signal to enter or exit a trade.
Core Functionality
The tool monitors two distinct moving averages on your price chart: a "Faster" average and a "Slower" average. By comparing these two lines, the script detects shifts in momentum:
- Bullish Signals (Buy): When the Faster MA climbs above the Slower MA, the script identifies a potential upward trend.
- Bearish Signals (Sell): When the Faster MA drops below the Slower MA, the script identifies a potential downward trend.
Visual Indicators and Alerts
Instead of making you squint at overlapping lines to find the exact crossover point, the script provides clear visual cues directly on your chart:
- Automatic Plotting: It places specific symbols (arrows) at the precise location where the crossover occurs. This is particularly helpful when using very short timeframes or when the chart is zoomed out, making it difficult to see the actual lines clearly.
- Dynamic Positioning: To ensure the symbols do not clutter the price candles, the script calculates the "range" of recent price action and places the signals slightly above or below the current candle.
- Real-Time Notifications: The tool includes an optional alert system. If enabled, it will trigger a pop-up notification on your screen the moment a new "Buy" or "Sell" signal is detected in real-time.
Customization Options
The script offers several ways to tailor the logic to your specific trading style:
- Average Types: You can choose between different calculation methods for your averages, such as Simple (SMA), Exponential (EMA), Smoothed (SMMA), or Linear Weighted (LWMA).
- Adjustable Periods: You can define the length of both the Faster and Slower averages (e.g., setting a 5-period average against a 12-period average) to suit your preferred sensitivity.
- Chart Cleanup: Because the script handles the "math" of the crossover for you, it allows you to remove the actual moving average lines from your view, leaving a cleaner chart with only the relevant entry signals visible.
Indicators Used
Miscellaneous
11
Views
0
Downloads
0
Favorites
MA_Crossover_Signal_001
//+------------------------------------------------------------------+
//|                                         EMA-Crossover_Signal.mq4 |
//|         Copyright © 2005, Jason Robinson (jnrtrading)            |
//|                   http://www.jnrtading.co.uk                     |
//+------------------------------------------------------------------+

/*
  +------------------------------------------------------------------+
  | Allows you to enter two ema periods and it will then show you at |
  | Which point they crossed over. It is more usful on the shorter   |
  | periods that get obscured by the bars / candlesticks and when    |
  | the zoom level is out. Also allows you then to remove the emas   |
  | from the chart. (emas are initially set at 5 and 6)              |
  +------------------------------------------------------------------+
*/
#property copyright "Copyright © 2005, Jason Robinson (jnrtrading)"
#property link      "http://www.jnrtrading.co.uk"

#property indicator_chart_window
#property indicator_buffers 2
#property indicator_color1 DarkGreen
#property indicator_width1 3
#property indicator_color2 Red
#property indicator_width2 3

double CrossUp[];
double CrossDown[];
extern string note1 = "0=sma, 1=ema, 2=smma, 3=lwma";
extern int FasterMode = 1; //0=sma, 1=ema, 2=smma, 3=lwma
extern string note2 = "First MA";
extern int FasterMA =   5;
extern string note3 = "0=sma, 1=ema, 2=smma, 3=lwma";
extern int SlowerMode = 1; //0=sma, 1=ema, 2=smma, 3=lwma
extern string note4 = "Second MA";
extern int SlowerMA =   12;
extern bool UseAlert = False;
double alertBar;
//+------------------------------------------------------------------+
//| Custom indicator initialization function                         |
//+------------------------------------------------------------------+
int init()
  {
//---- indicators
   SetIndexStyle(0, DRAW_ARROW, EMPTY);
   SetIndexArrow(0, 233);
   SetIndexBuffer(0, CrossUp);
   SetIndexStyle(1, DRAW_ARROW, EMPTY);
   SetIndexArrow(1, 234);
   SetIndexBuffer(1, CrossDown);

//----
   return(0);
  }
//+------------------------------------------------------------------+
//| Custom indicator deinitialization function                       |
//+------------------------------------------------------------------+
int deinit()
  {
//----

//----
   return(0);
  }
//+------------------------------------------------------------------+
//| Custom indicator iteration function                              |
//+------------------------------------------------------------------+
int start() {
   int limit, i, counter;
   double fasterMAnow, slowerMAnow, fasterMAprevious, slowerMAprevious, fasterMAafter, slowerMAafter;
   double Range, AvgRange;
   int counted_bars=IndicatorCounted();
//---- check for possible errors
   if(counted_bars<0) return(-1);
//---- last counted bar will be recounted
   if(counted_bars>0) counted_bars--;

   limit=Bars-counted_bars;

   for(i = 0; i <= limit; i++) {

      counter=i;
      Range=0;
      AvgRange=0;
      for (counter=i ;counter<=i+9;counter++)
      {
         AvgRange=AvgRange+MathAbs(High[counter]-Low[counter]);
      }
      Range=AvgRange/10;

      fasterMAnow = iMA(NULL, 0, FasterMA, 0, FasterMode, PRICE_CLOSE, i);
      fasterMAprevious = iMA(NULL, 0, FasterMA, 0, FasterMode, PRICE_CLOSE, i+1);
      fasterMAafter = iMA(NULL, 0, FasterMA, 0, FasterMode, PRICE_CLOSE, i-1);

      slowerMAnow = iMA(NULL, 0, SlowerMA, 0, SlowerMode, PRICE_CLOSE, i);
      slowerMAprevious = iMA(NULL, 0, SlowerMA, 0, SlowerMode, PRICE_CLOSE, i+1);
      slowerMAafter = iMA(NULL, 0, SlowerMA, 0, SlowerMode, PRICE_CLOSE, i-1);

      if ((fasterMAnow > slowerMAnow) && (fasterMAprevious < slowerMAprevious) && (fasterMAafter > slowerMAafter)) {
         CrossUp[i] = Low[i] - Range*1.5;
         if (UseAlert==1 && Bars>alertBar) Alert(Symbol(), "Buy signal", Period());alertBar = Bars;
      }
      else if ((fasterMAnow < slowerMAnow) && (fasterMAprevious > slowerMAprevious) && (fasterMAafter < slowerMAafter)) {
         CrossDown[i] = High[i] + Range*1.5;
         if (UseAlert==1 && Bars>alertBar) Alert(Symbol(), "Sell signal", Period());alertBar = Bars;
      }
   }
   return(0);
}
Comments