18_28Cross
Download script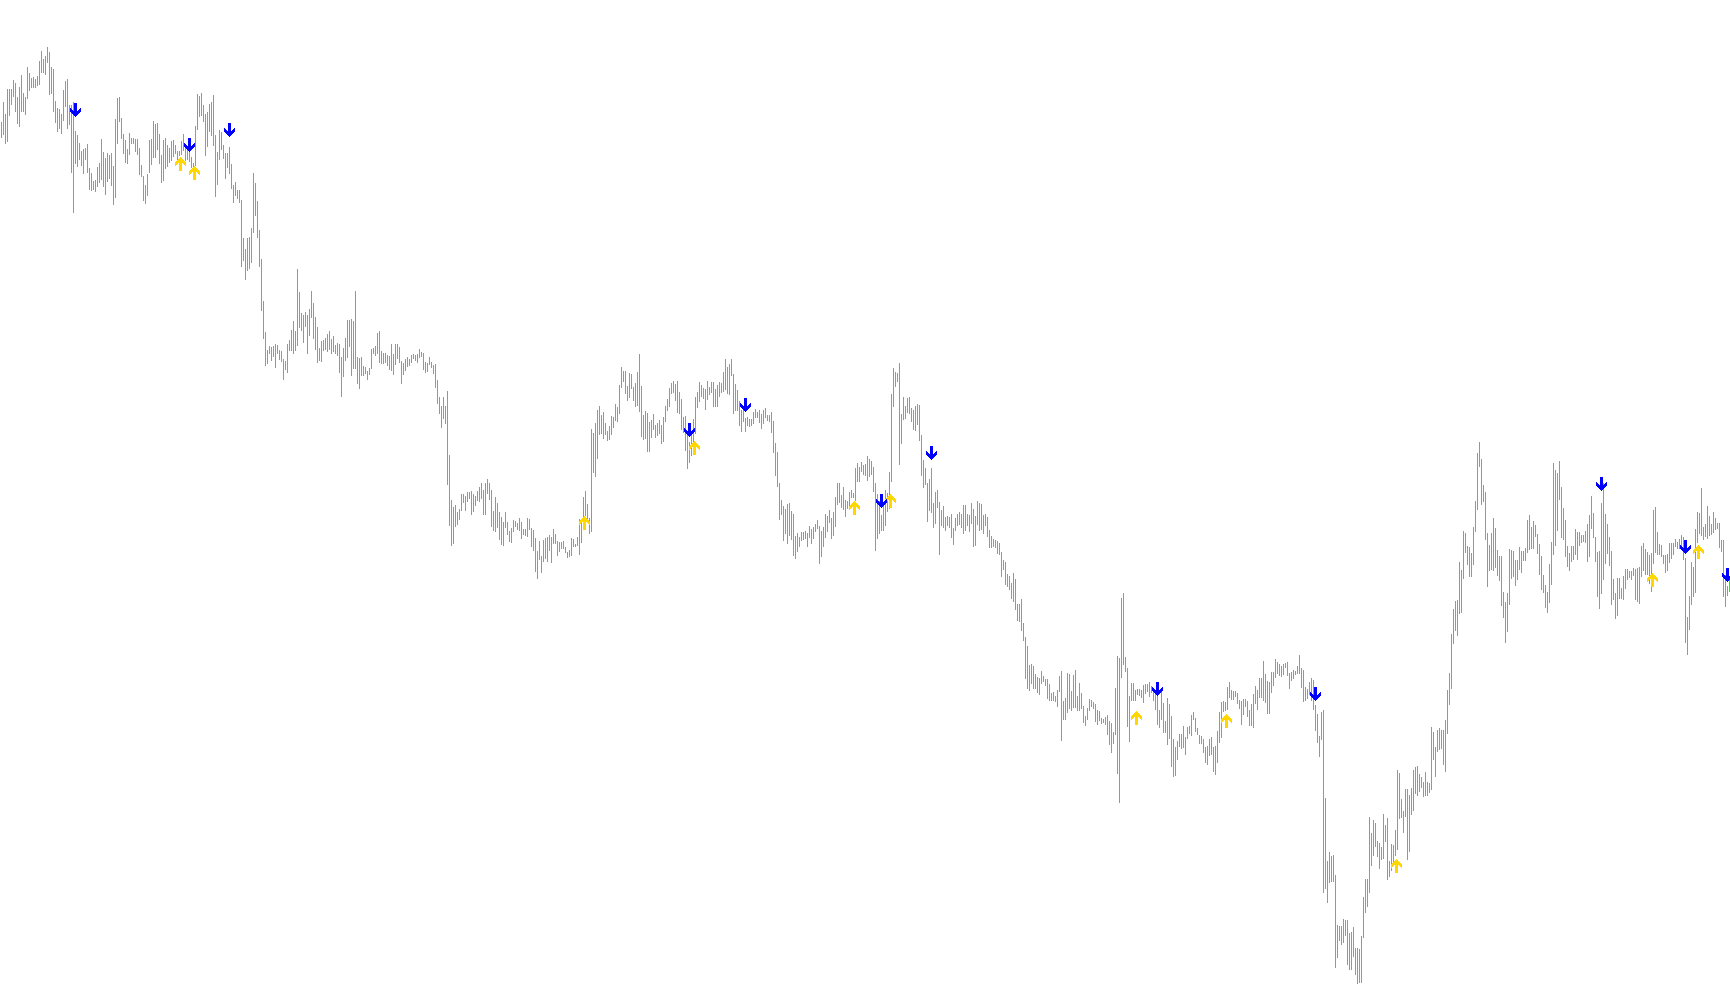
This tool is a technical analysis indicator designed to identify specific momentum shifts in the financial markets by tracking the interaction between two moving averages. It simplifies the complexity of price action into visual cues, helping traders spot potential trend reversals or continuations more easily.
Core Logic and Methodology
The script functions by calculating two different types of "Moving Averages"—one set to a faster speed (set at 18 periods) and one set to a slower speed (set at 28 periods). Moving averages are used in trading to smooth out random price fluctuations and highlight the underlying direction of the market.
The primary logic relies on a "Crossover" strategy. Instead of just looking at where the prices are currently, the tool analyzes the relationship between these two averages over three consecutive points in time: the current candle, the previous candle, and the upcoming projected data point.
How it Identifies Signals
The indicator looks for very specific mathematical conditions to trigger a visual signal:
- Bullish Signals (Upward): The tool identifies an "Upward Cross" when the faster moving average moves from being below the slower average to positioned above it. To ensure accuracy and filter out "noise," it verifies that this shift is consistent across the immediate past, present, and future relative data points.
- Bearish Signals (Downward): Conversely, it identifies a "Downward Cross" when the faster moving average drops from above the slower average to positioned below it.
Visual Representation and Dynamic Spacing
When the script detects one of these crossover conditions, it places an arrow on your chart:
- Blue Arrows appear below the price for upward trends.
- Red Arrows appear above the price for downward trends.
One unique feature of this specific logic is its use of Dynamic Range Calculation. Rather than placing the arrows at a fixed distance from the candles, the script calculates the average height (volatility) of the last 10 candles. It then uses this average to position the arrows perfectly so that they remain visible and clear, regardless of whether the market is moving in small, tight increments or large, aggressive swings.
Customization Options
The tool provides users with several "levers" to adjust how it perceives the market:
- Average Types: You can choose between different mathematical formulas for the averages (such as Simple, Exponential, Smoothed, or Linear Weighted) depending on how reactive you want the indicator to be.
- Time Periods: You can modify the lengths of the faster and slower averages to suit different trading styles (e.g., shorter periods for day trading or longer periods for long-term investing).
- Alerts: The script includes an option to trigger audible notifications when these crossovers occur, allowing for real-time monitoring without needing to watch the screen constantly.
//+------------------------------------------------------------------+
//|                                                   18_28Cross.mq4 |
//|                      Copyright © 2006, MetaQuotes Software Corp. |
//|                                        http://www.metaquotes.net |
//+------------------------------------------------------------------+
#property copyright "Copyright © 2006, MetaQuotes Software Corp."
#property link      "http://www.metaquotes.net"

#property indicator_chart_window
#property indicator_buffers 2
#property indicator_color1 Blue
#property indicator_color2 Red

double CrossUp[];
double CrossDown[];
extern int FasterMode = 1; //0=sma, 1=ema, 2=smma, 3=lwma
extern int FasterMA =   18;
extern int SlowerMode = 1; //0=sma, 1=ema, 2=smma, 3=lwma
extern int SlowerMA =   28;
extern int SoundAlert =    1; // 0 = disabled
//+------------------------------------------------------------------+
//| Custom indicator initialization function                         |
//+------------------------------------------------------------------+
int init()
  {
//---- indicators
   SetIndexStyle(0, DRAW_ARROW, EMPTY);
   SetIndexArrow(0, 233);
   SetIndexBuffer(0, CrossUp);
   SetIndexStyle(1, DRAW_ARROW, EMPTY);
   SetIndexArrow(1, 234);
   SetIndexBuffer(1, CrossDown);
//----
   return(0);
  }
//+------------------------------------------------------------------+
//| Custom indicator deinitialization function                       |
//+------------------------------------------------------------------+
int deinit()
  {
//----

//----
   return(0);
  }
//+------------------------------------------------------------------+
//| Custom indicator iteration function                              |
//+------------------------------------------------------------------+
int start() {
   int limit, i, counter;
   double fasterMAnow, slowerMAnow, fasterMAprevious, slowerMAprevious, fasterMAafter, slowerMAafter;
   double Range, AvgRange;
   int counted_bars=IndicatorCounted();
//---- check for possible errors
   if(counted_bars<0) return(-1);
//---- last counted bar will be recounted
   if(counted_bars>0) counted_bars--;

   limit=Bars-counted_bars;

   for(i = 0; i <= limit; i++) {

      counter=i;
      Range=0;
      AvgRange=0;
      for (counter=i ;counter<=i+9;counter++)
      {
         AvgRange=AvgRange+MathAbs(High[counter]-Low[counter]);
      }
      Range=AvgRange/10;

      fasterMAnow = iMA(NULL, 0, FasterMA, 0, FasterMode, PRICE_CLOSE, i);
      fasterMAprevious = iMA(NULL, 0, FasterMA, 0, FasterMode, PRICE_CLOSE, i+1);
      fasterMAafter = iMA(NULL, 0, FasterMA, 0, FasterMode, PRICE_CLOSE, i-1);

      slowerMAnow = iMA(NULL, 0, SlowerMA, 0, SlowerMode, PRICE_CLOSE, i);
      slowerMAprevious = iMA(NULL, 0, SlowerMA, 0, SlowerMode, PRICE_CLOSE, i+1);
      slowerMAafter = iMA(NULL, 0, SlowerMA, 0, SlowerMode, PRICE_CLOSE, i-1);

      if ((fasterMAnow > slowerMAnow) && (fasterMAprevious < slowerMAprevious) && (fasterMAafter > slowerMAafter)) {
         CrossUp[i] = Low[i] - Range*0.5 ;
      }
      else if ((fasterMAnow < slowerMAnow) && (fasterMAprevious > slowerMAprevious) && (fasterMAafter < slowerMAafter)) {
         CrossDown[i] = High[i] + Range*0.5;
      }

   }
   return(0);
}
Comments