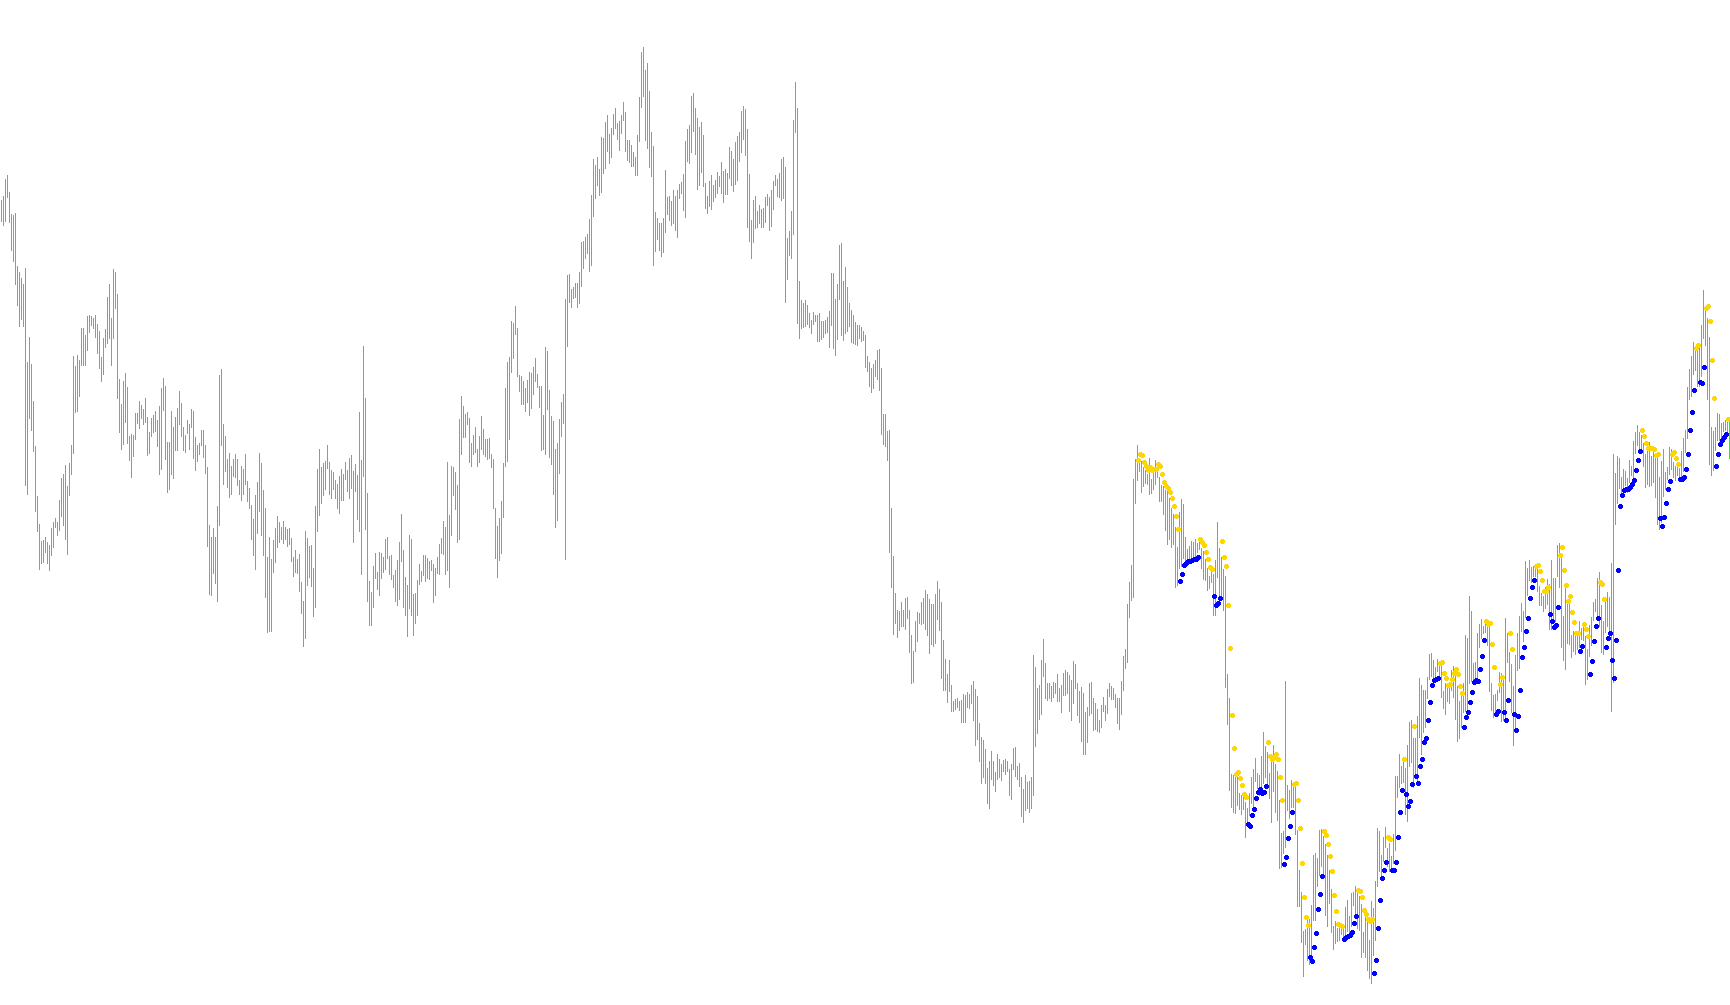
Overview
This technical indicator is designed to assist traders in identifying potential trend shifts and price extremes by monitoring the relationship between current market prices and a moving average of high and low price points. Rather than just following the general direction of the market, it focuses on detecting specific "breakout" moments where the price moves beyond established boundaries.
How It Works
The logic operates by calculating two distinct boundaries based on a user-defined period:
- The Upper Boundary: Derived from the average of the highest prices over a recent timeframe.
- The Lower Boundary: Derived from the average of the lowest prices over a recent timeframe.
The indicator constantly compares the current closing price against these two boundaries to determine the market's state. It looks for specific triggers:
- Bullish Signal Detection: When the price closes above the upper boundary, the script identifies a shift toward upward momentum.
- Bearish Signal Detection: When the price closes below the lower boundary, the script identifies a shift toward downward momentum.
Visual Representation
To make this data easy to read on a trading chart, the indicator uses visual markers (arrows) instead of continuous lines:
- Upward Markers: These appear when the logic confirms a bullish condition, signaling that the price has pushed above the upper threshold.
- Downward Markers: These appear when the logic confirms a bearish condition, signaling that the price has dropped below the lower threshold.
Key Behavior
The script is designed to be "reactive." It tracks the state of the previous candle to ensure it captures transitions in momentum accurately. By filtering out minor fluctuations and focusing on these specific boundary breaches, it aims to highlight significant price movements for the trader, helping to distinguish between standard market noise and a potential change in trend direction.
/*-----------------------------+
|			       |
| Shared by www.Aptrafx.com    |
|			       |
+------------------------------*/

//+------------------------------------------------------------------+
//|                                                        Hi-Lo.mq4 |
//|                                                                  |
//|                                        Ramdass - Conversion only |
//+------------------------------------------------------------------+

#property indicator_chart_window
#property indicator_buffers 2
#property indicator_color1 Red
#property indicator_color2 Lime
//---- input parameters
extern int Per=3;
extern int CountBars=300;
//---- buffers
double Up[];
double Down[];
//+------------------------------------------------------------------+
//| Custom indicator initialization function                         |
//+------------------------------------------------------------------+
int init()
  {

//---- indicator line
   IndicatorBuffers(2);
   SetIndexStyle(0,DRAW_ARROW);
   SetIndexArrow(0,159);
   SetIndexStyle(1,DRAW_ARROW);
   SetIndexArrow(1,159);
   SetIndexBuffer(0,Up);
   SetIndexBuffer(1,Down);
//----
//----
   return(0);
  }
//+------------------------------------------------------------------+
//| Hi-Lo                                                         |
//+------------------------------------------------------------------+
int start()
  {
   SetIndexDrawBegin(0,Bars-CountBars+Per);
   SetIndexDrawBegin(1,Bars-CountBars+Per);
   int i,counted_bars=IndicatorCounted();
   bool Pr=false, PrevPr=false;
   double val,val2;
//----
   if(CountBars<=Per) return(0);
//---- initial zero
   if(counted_bars<1)
   {
      for(i=1;i<=Per;i++) Up[CountBars-i]=0.0;
      for(i=1;i<=Per;i++) Down[CountBars-i]=0.0;
   }
//----
   i=CountBars-Per-1;
//   if(counted_bars>=CCIPeriod1) i=Bars-counted_bars-1;
   while(i>=0)
     {
      val=iMA(NULL,0,Per,1,MODE_SMA,PRICE_HIGH,i);
      val2=iMA(NULL,0,Per,1,MODE_SMA,PRICE_LOW,i);

if (Close[i]<val2 && PrevPr==true) Pr=false;
if (Close[i]>val && PrevPr==false) Pr=true;
PrevPr=Pr;
Up[i]=0.0; Down[i]=0.0;
if (Pr==false) Up[i] = val+2*Point;
if (Pr==true) Down[i] = val2-2*Point;

      i--;
     }
   return(0);
  }
//+------------------------------------------------------------------+
Comments