Laguerre PlusDi_v1
Download script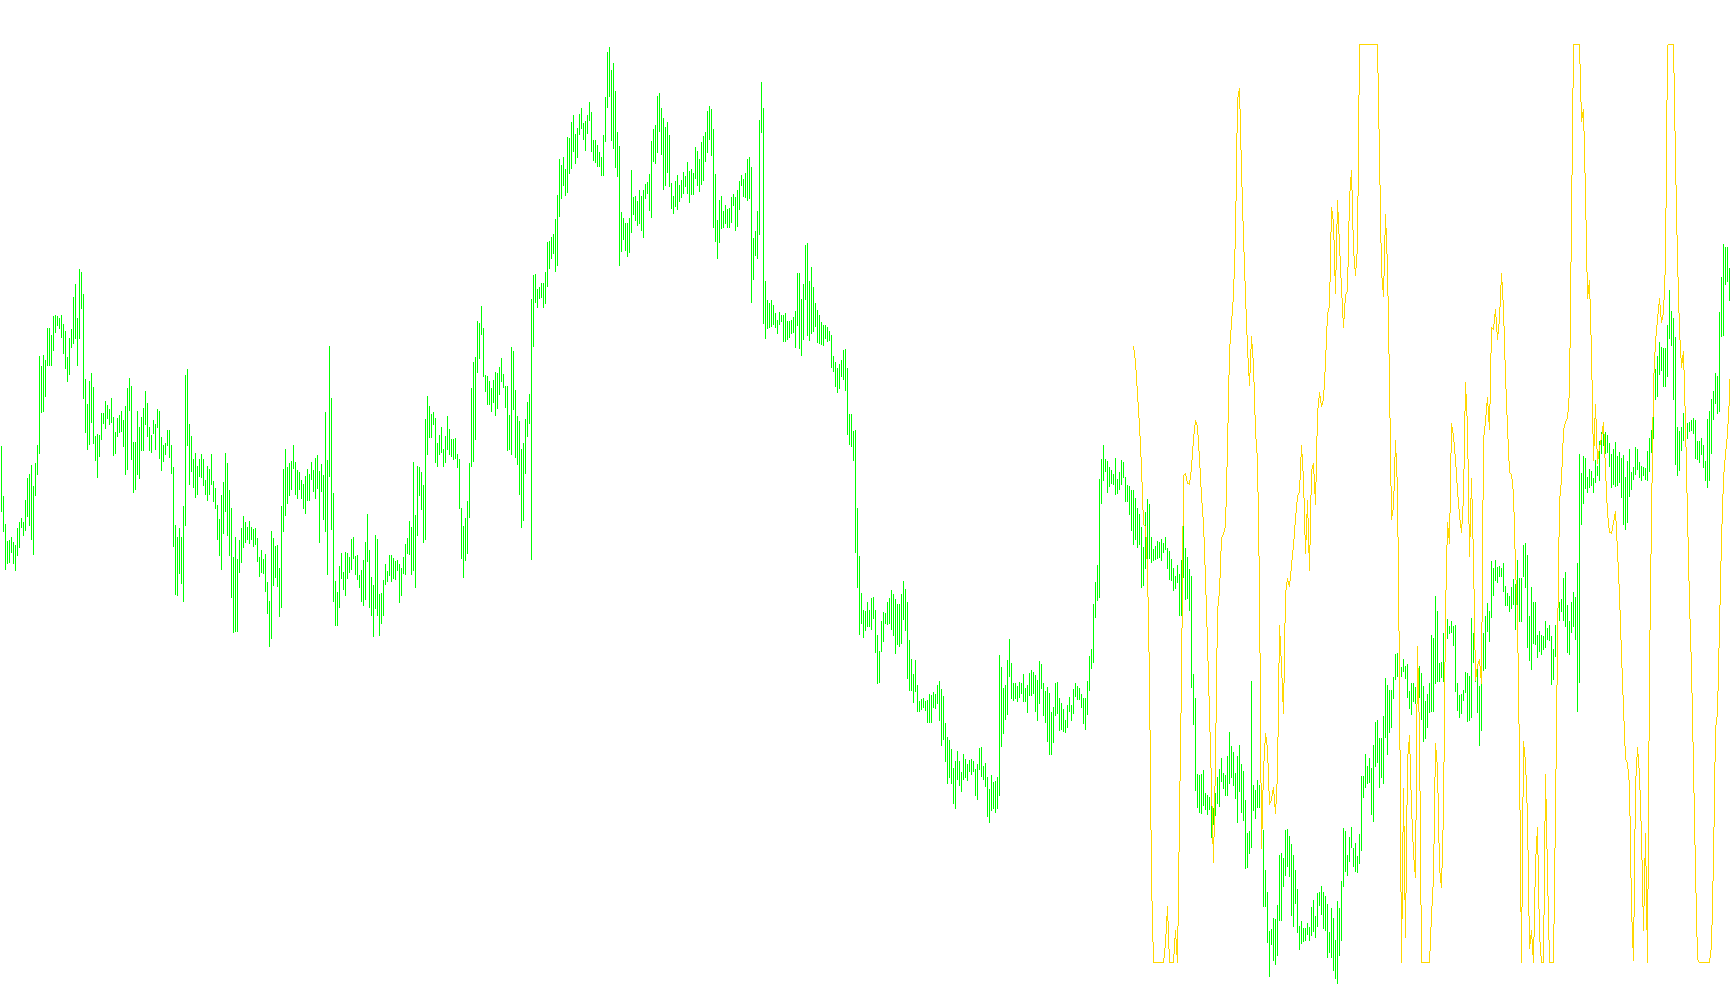
This tool is a technical analysis indicator designed to help traders gauge the strength and direction of market momentum by blending two distinct mathematical concepts: the Laguerre filter and the Relative Strength Index (RSI) logic, specifically applied to directional movement.
Core Functionality
The primary goal of this script is to smooth out market "noise" while providing a clear visualization of whether the prevailing trend is moving upward or downward. Unlike standard indicators that might react too quickly to minor price fluctuations, this logic uses a specific smoothing coefficient (Gamma) to create a more stable reading of price action over a set number of periods.
How the Logic Works
The indicator processes market data through three main stages:
1. Data Input and Smoothing The script starts by looking at the "Plus Di" component of the ADX (Average Directional Index). The Plus Di is a standard metric used to measure the strength of an upward trend. Instead of using this raw value, the script applies a Laguerre filtering technique. This involves taking the current price movement and blending it with previous values based on a specific weight (Gamma). This creates a series of "running" averages that are less erratic than standard moving averages.
2. Comparative Analysis Once the data is smoothed, the logic compares four different layers of these smoothed values against one another. It looks for the gaps between these layers to determine the "velocity" of the price movement. By calculating the differences between these consecutive levels, the script can identify how aggressively the market is pushing in one direction versus another.
3. Final Momentum Calculation The final step takes all those identified differences and converts them into a single percentage-based value. This behaves similarly to a Relative Strength Index (RSI), where the result is expressed as a proportion.
- If the upward momentum is dominant, the indicator moves toward the top of its range.
- If the downward momentum is dominant, it moves toward the bottom.
User Visuals and Interpretation
The output is displayed in a separate window on your trading chart, typically ranging between 0 and 1 (or 0% to 100%). It includes horizontal levels that act as visual benchmarks:
- Upper Levels: Indicate high-strength momentum.
- Middle Levels: Indicate equilibrium or transition phases where the market may be consolidating.
- Lower Levels: Indicate strong downward pressure.
By watching how the line moves between these levels, a trader can visually identify whether the current trend is accelerating, slowing down, or potentially reaching an exhaustion point.
/*-----------------------------+
|			       |
| Shared by www.Aptrafx.com    |
|			       |
+------------------------------*/

//+--------------------------------------------------------------------------+
//| Laguerre PlusDi.mq4                                                      |
//| Emerald King / transport_david                                           |
//| http://finance.groups.yahoo.com/group/MetaTrader_Experts_and_Indicators/ |
//+--------------------------------------------------------------------------+
#property copyright "Copyright © 2005"
#property link      "http://finance.groups.yahoo.com/group/MetaTrader_Experts_and_Indicators/"

#property indicator_separate_window
#property indicator_minimum -0.05
#property indicator_maximum 1.05
#property indicator_color1 LawnGreen
#property indicator_level2 0.75
#property indicator_level3 0.50
#property indicator_level4 0.25
//---- input parameters
extern double periods=14;
extern double timeperiods=0;
extern double gamma=0.764;
extern int CountBars=300;

double L0 = 0;
double L1 = 0;
double L2 = 0;
double L3 = 0;
double L0A = 0;
double L1A = 0;
double L2A = 0;
double L3A = 0;
double LRSI = 0;
double CU = 0;
double CD = 0;

double val1[];
//+------------------------------------------------------------------+
//| Custom indicator initialization function                         |
//+------------------------------------------------------------------+

int init()
  {
//---- indicators
//----
   SetIndexBuffer(0,val1);
   return(0);
  }
//+------------------------------------------------------------------+
//| Custor indicator deinitialization function                       |
//+------------------------------------------------------------------+
int deinit()
  {
//---- TODO: add your code here

//----
   return(0);
  }
//+------------------------------------------------------------------+
//| Custom indicator iteration function                              |
//+------------------------------------------------------------------+
int start()
  {
   if (CountBars>Bars) CountBars=Bars;
   SetIndexDrawBegin(0,Bars-CountBars);

   int i;
   int    counted_bars=IndicatorCounted();

   //if(CountBars<=Lookback) return(0);
   //---- initial zero
   //if(counted_bars<1)
   //{
   //   for(i=1;i<=Lookback;i++) val1[CountBars-i]=0.0;
   //}

   i=CountBars-1;
   while(i>=0)
   {
      L0A = L0;
      L1A = L1;
      L2A = L2;
      L3A = L3;
      L0 = ((1 - gamma)*iADX(NULL,timeperiods,periods,PRICE_HIGH,MODE_PLUSDI,i)) + gamma*L0A;
      L1 = ((- gamma *L0) + L0A) + (gamma *L1A);
      L2 = ((- gamma *L1) + L1A) + (gamma *L2A);
      L3 = ((- gamma *L2) + L2A) + (gamma *L3A);

      CU = 0;
      CD = 0;

      if (L0 >= L1) CU = L0 - L1; else CD = L1 - L0;
      if (L1 >= L2) CU = CU + L1 - L2; else CD = CD + L2 - L1;
      if (L2 >= L3) CU = CU + L2 - L3; else CD = CD + L3 - L2;

      if (CU + CD != 0) LRSI = CU / (CU + CD);
      val1[i] = LRSI;
	  i--;
	}
   return(0);
 }
//+------------------------------------------------------------------+
Comments