Laguerre PlusDi
Download script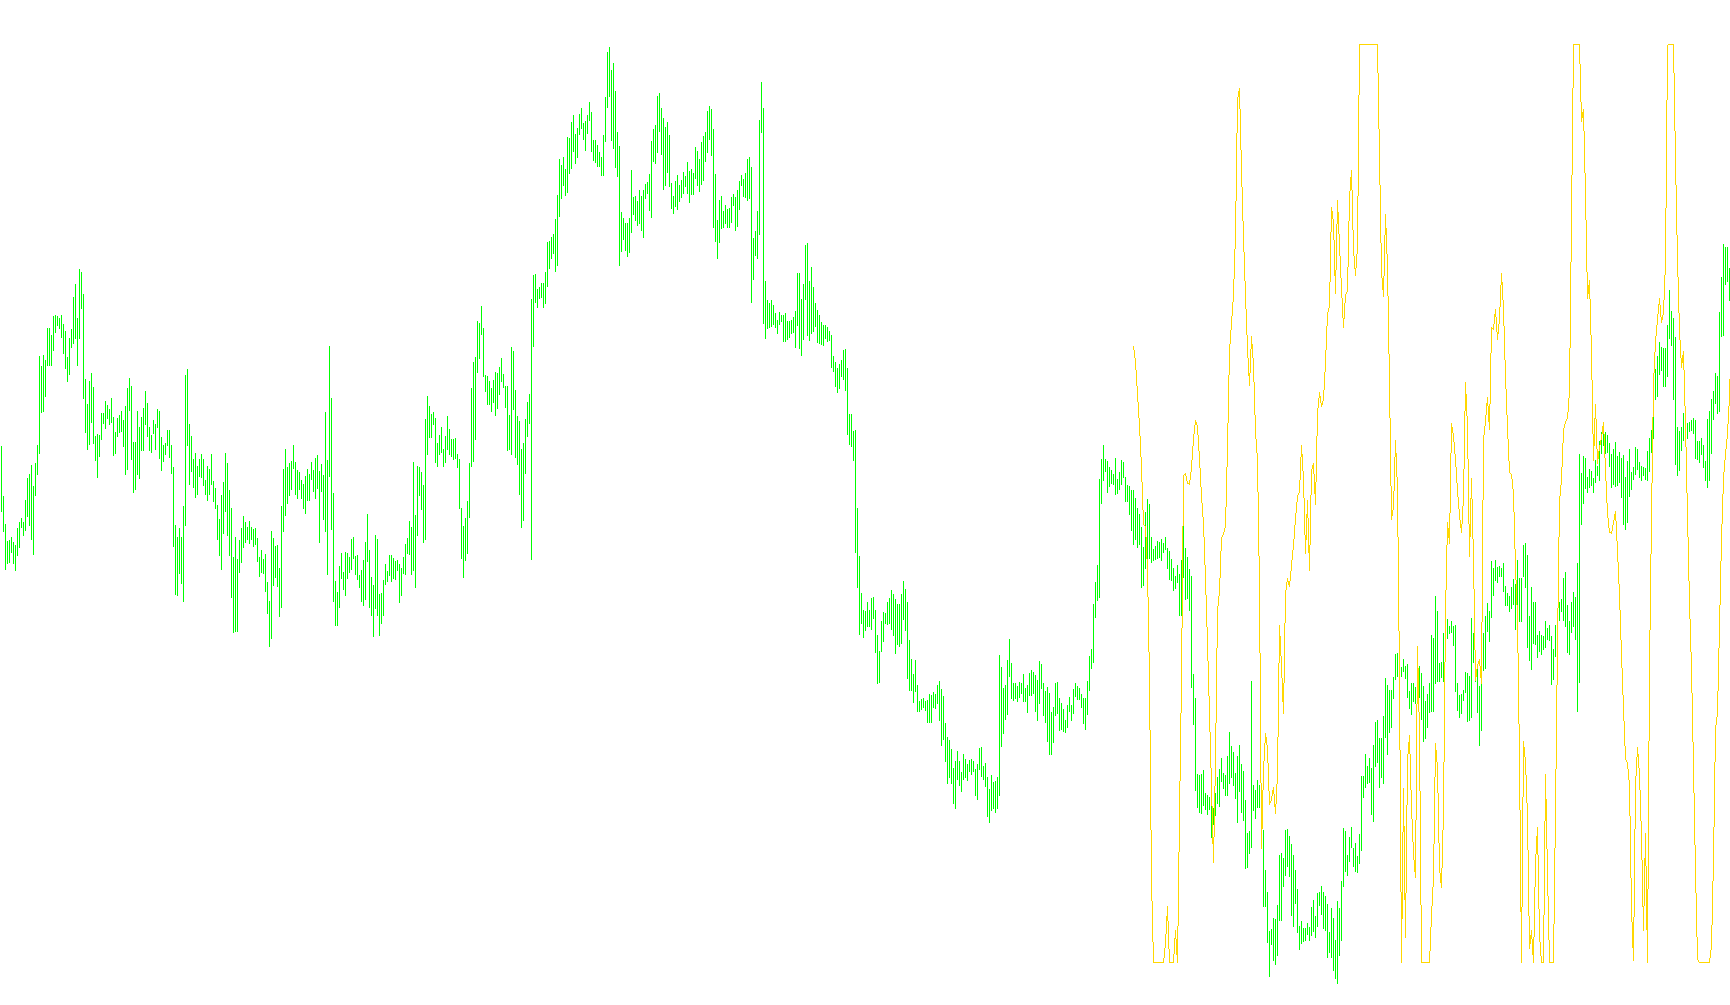
This script is a custom financial analysis tool designed to provide a smoothed, responsive visualization of market momentum and trend direction. It combines advanced mathematical smoothing techniques with established trend indicators to help traders identify the relative strength of price movements in real-time.
Core Logic Overview
The primary goal of this script is to take complex market data—specifically "Plus Di" values (which measure upward price pressure)—and filter out the "noise" often found in raw trading charts. It does this by applying a multi-layered smoothing process that balances current price action with historical trends.
How it Works
The logic can be broken down into three distinct stages:
1. Data Input & Filtering The script begins by pulling information from a "Plus Di" indicator over a user-defined number of periods. Instead of looking at just the most recent price, it examines a specific window of history to establish a baseline for upward momentum.
2. The Laguerre Smoothing Process This is the technical heart of the script. It utilizes a specialized mathematical framework (Laguerre smoothing) to process the data.
- It maintains four different layers of historical data points simultaneously.
- By blending these layers using a specific "gamma" factor, the script ensures that the resulting line is smooth enough to prevent erratic jumps while remaining fast enough to react quickly to sudden price changes.
- This dual-action approach allows the indicator to be more responsive than traditional moving averages, which can sometimes lag significantly behind actual market movements.
3. Relative Strength Calculation In the final stage, the script compares these smoothed layers against one another. It calculates the differences between the various levels of data to determine whether the trend is currently accelerating or decelerating.
- The final output is expressed as a normalized value (a percentage-like figure).
- This allows traders to see at a glance where the market stands: a higher value suggests strong upward momentum, while a lower value indicates downward pressure.
Visual Representation
The result is displayed in a separate window on your trading platform. It provides a clean, fluid line that represents the "heartbeat" of the trend. By observing how this line moves relative to the 0.75, 0.50, and 0.25 levels provided in the settings, users can better identify periods of high-strength momentum versus periods of exhaustion or reversal.
//+--------------------------------------------------------------------------+
//| Laguerre PlusDi.mq4                                                      |
//| Emerald King / transport_david                                           |
//| http://finance.groups.yahoo.com/group/MetaTrader_Experts_and_Indicators/ |
//+--------------------------------------------------------------------------+
#property copyright "Copyright © 2005"
#property link      "http://finance.groups.yahoo.com/group/MetaTrader_Experts_and_Indicators/"

#property indicator_separate_window
#property indicator_minimum -0.05
#property indicator_maximum 1.05
#property indicator_color1 LawnGreen
#property indicator_level2 0.75
#property indicator_level3 0.50
#property indicator_level4 0.25
//---- input parameters
extern double periods=14;
extern double timeperiods=0;
extern double gamma=0.764;
extern int CountBars=300;

double L0 = 0;
double L1 = 0;
double L2 = 0;
double L3 = 0;
double L0A = 0;
double L1A = 0;
double L2A = 0;
double L3A = 0;
double LRSI = 0;
double CU = 0;
double CD = 0;

double val1[];
//+------------------------------------------------------------------+
//| Custom indicator initialization function                         |
//+------------------------------------------------------------------+

int init()
  {
//---- indicators
//----
   SetIndexBuffer(0,val1);
   return(0);
  }
//+------------------------------------------------------------------+
//| Custor indicator deinitialization function                       |
//+------------------------------------------------------------------+
int deinit()
  {
//---- TODO: add your code here

//----
   return(0);
  }
//+------------------------------------------------------------------+
//| Custom indicator iteration function                              |
//+------------------------------------------------------------------+
int start()
  {
   if (CountBars>Bars) CountBars=Bars;
   SetIndexDrawBegin(0,Bars-CountBars);

   int i;
   int    counted_bars=IndicatorCounted();

   //if(CountBars<=Lookback) return(0);
   //---- initial zero
   //if(counted_bars<1)
   //{
   //   for(i=1;i<=Lookback;i++) val1[CountBars-i]=0.0;
   //}

   i=CountBars-1;
   while(i>=0)
   {
      L0A = L0;
      L1A = L1;
      L2A = L2;
      L3A = L3;
      L0 = ((1 - gamma)*iADX(NULL,timeperiods,periods,PRICE_HIGH,MODE_PLUSDI,i)) + gamma*L0A;
      L1 = ((- gamma *L0) + L0A) + (gamma *L1A);
      L2 = ((- gamma *L1) + L1A) + (gamma *L2A);
      L3 = ((- gamma *L2) + L2A) + (gamma *L3A);

      CU = 0;
      CD = 0;

      if (L0 >= L1) CU = L0 - L1; else CD = L1 - L0;
      if (L1 >= L2) CU = CU + L1 - L2; else CD = CD + L2 - L1;
      if (L2 >= L3) CU = CU + L2 - L3; else CD = CD + L3 - L2;

      if (CU + CD != 0) LRSI = CU / (CU + CD);
      val1[i] = LRSI;
	  i--;
	}
   return(0);
 }
//+------------------------------------------------------------------+
Comments