Laguerre MinusDi_v2
Download script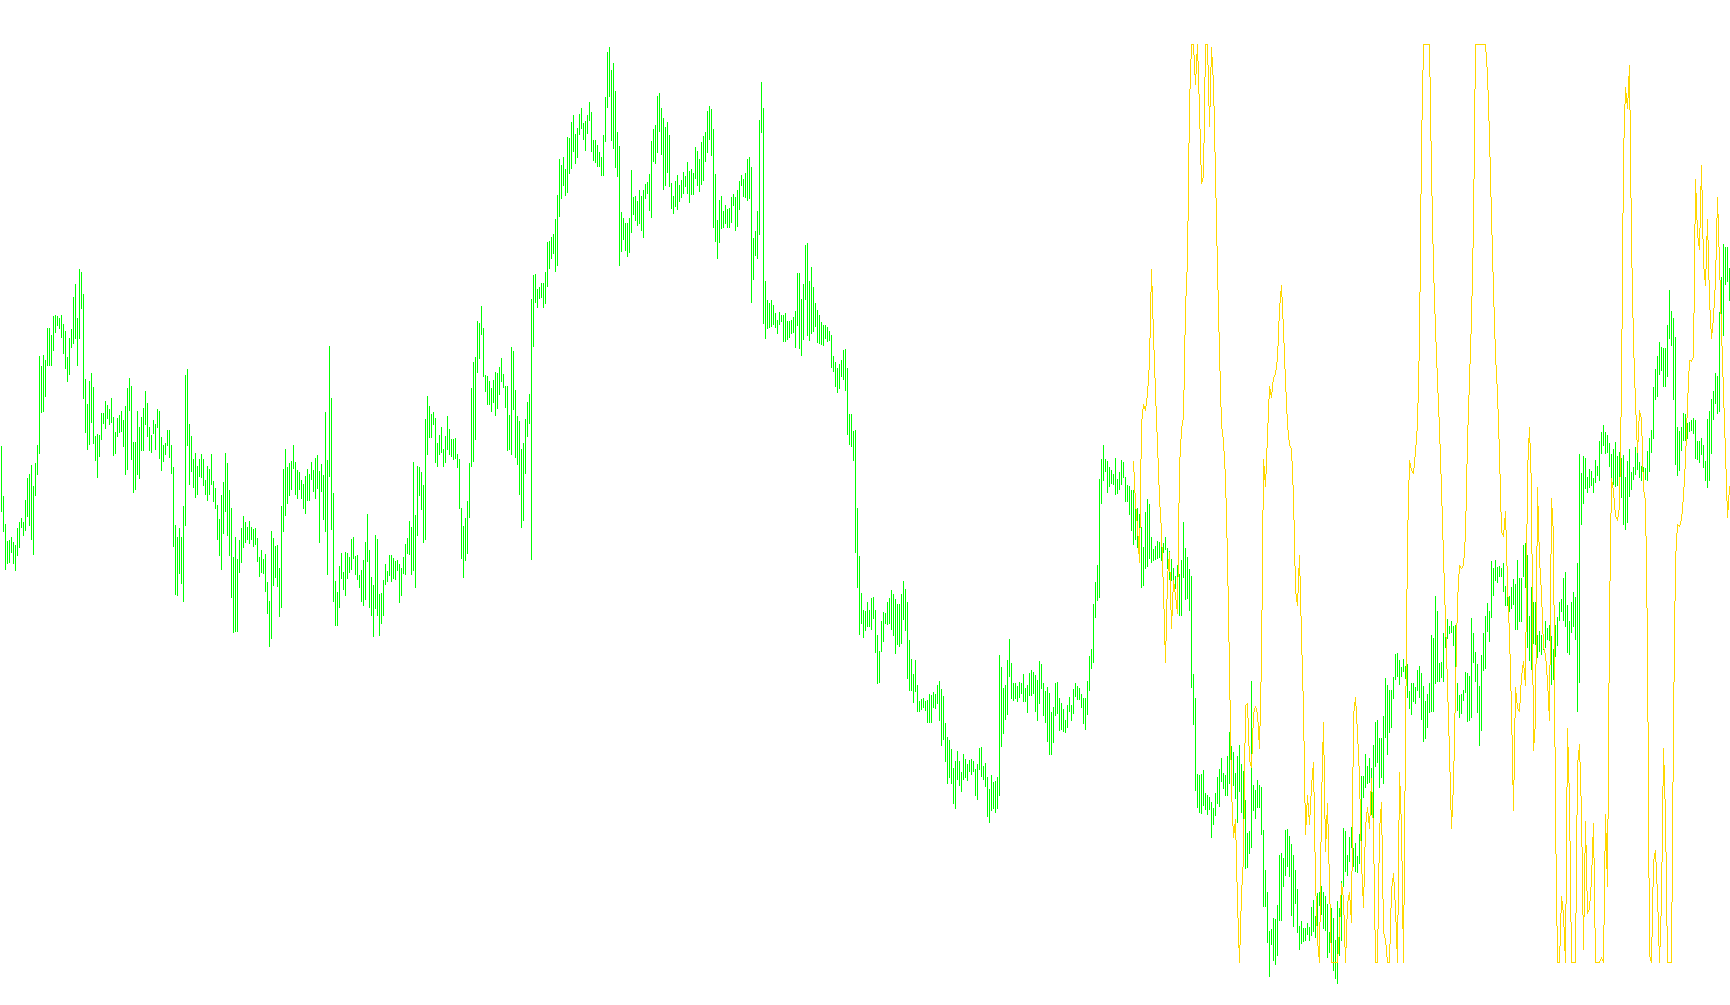
This tool is designed to provide traders with a smoothed, filtered view of market momentum by combining two sophisticated mathematical concepts: the Laguerre filter and the Minus Directional Index (MinusDi). Unlike standard indicators that can be "noisy" or jump around erratically, this script aims to create a more fluid visualization of price trends.
Core Logic Overview
The indicator operates by processing price data through three distinct logical phases:
1. Data Extraction The process begins by identifying the "Minus Directional Index." In trading terms, this is a metric used to measure the strength of downward pressure in the market. The script pulls this specific data point over a user-defined timeframe (the "periods" setting).
2. The Laguerre Smoothing Effect Once the downward pressure data is captured, the script applies a series of recursive calculations known as Laguerre filters. It processes the data through four different layers ($L0$ through $L3$).
- Think of this like a multi-stage filter: each layer takes the previous result and blends it with new information using a specific weighting factor (Gamma).
- This creates a "smoothing" effect that eliminates minor market jitters while preserving the overall direction of the trend. It ensures that the final output doesn't react too violently to every tiny price tick.
3. Relative Strength Calculation After the data has been smoothed through all four layers, the script performs a final calculation to determine the relative balance between "Up" and "Down" movements within those filtered values.
- It compares the differences between each of the four layers.
- It sums these differences to see which direction is dominant.
- The final result is expressed as a ratio (an RSI-style value).
How to Interpret the Result
The indicator produces a value plotted in a separate window, typically ranging between 0 and 1 (or 0% and 100%).
- High Values: Indicate that the smoothed momentum is leaning heavily toward one side of the trend.
- Low Values: Indicate a shift in momentum toward the opposite side.
- Visual Guidance: By using these values, traders can get a clearer picture of whether the current market trend is gaining strength or losing steam, helping to filter out the "fake-out" signals that often appear in fast-moving markets.
//+--------------------------------------------------------------------------+
//| Laguerre MinusDi.mq4                                                     |
//| Emerald King / transport_david                                           |
//| http://finance.groups.yahoo.com/group/MetaTrader_Experts_and_Indicators/ |
//+--------------------------------------------------------------------------+
#property copyright "Copyright © 2005"
#property link      "http://finance.groups.yahoo.com/group/MetaTrader_Experts_and_Indicators/"
//----
#property indicator_separate_window
#property indicator_minimum -0.05
#property indicator_maximum 1.05
#property indicator_color1 Red
#property indicator_level2 0.75
#property indicator_level3 0.50
#property indicator_level4 0.25
//---- input parameters
extern double periods=14;
extern double timeperiods=0;
extern double gamma=0.764;
extern int CountBars=300;
//----
double L0=0;
double L1=0;
double L2=0;
double L3=0;
double L0A=0;
double L1A=0;
double L2A=0;
double L3A=0;
double LRSI=0;
double CU=0;
double CD=0;
double val1[];
//+------------------------------------------------------------------+
//| Custom indicator initialization function                         |
//+------------------------------------------------------------------+
int init()
  {
//---- indicators
//----
   SetIndexBuffer(0,val1);
   return(0);
  }
//+------------------------------------------------------------------+
//| Custor indicator deinitialization function                       |
//+------------------------------------------------------------------+
int deinit()
  {
//---- TODO: add your code here
//----
   return(0);
  }
//+------------------------------------------------------------------+
//| Custom indicator iteration function                              |
//+------------------------------------------------------------------+
int start()
  {
   if (CountBars>Bars) CountBars=Bars;
   SetIndexDrawBegin(0,Bars-CountBars);
//----
   int i;
   int    counted_bars=IndicatorCounted();
   //if(CountBars<=Lookback) return(0);
//---- initial zero
   //if(counted_bars<1)
   //{
   //   for(i=1;i<=Lookback;i++) val1[CountBars-i]=0.0;
   //}
   i=CountBars-1;
   while(i>=0)
     {
      L0A=L0;
      L1A=L1;
      L2A=L2;
      L3A=L3;
      L0=((1 - gamma)*iADX(NULL,timeperiods,periods,PRICE_LOW,MODE_MINUSDI,i)) + gamma*L0A;
      L1=((- gamma *L0) + L0A) + (gamma *L1A);
      L2=((- gamma *L1) + L1A) + (gamma *L2A);
      L3=((- gamma *L2) + L2A) + (gamma *L3A);
//----
      CU=0;
      CD=0;
//----
      if (L0>=L1) CU=L0 - L1; else CD=L1 - L0;
      if (L1>=L2) CU=CU + L1 - L2; else CD=CD + L2 - L1;
      if (L2>=L3) CU=CU + L2 - L3; else CD=CD + L3 - L2;
      if (CU + CD!=0) LRSI=CU/(CU + CD);
      val1[i]=LRSI;
      i--;
     }
   return(0);
  }
//+------------------------------------------------------------------+
Comments