LaguerreVolume_v1
Download script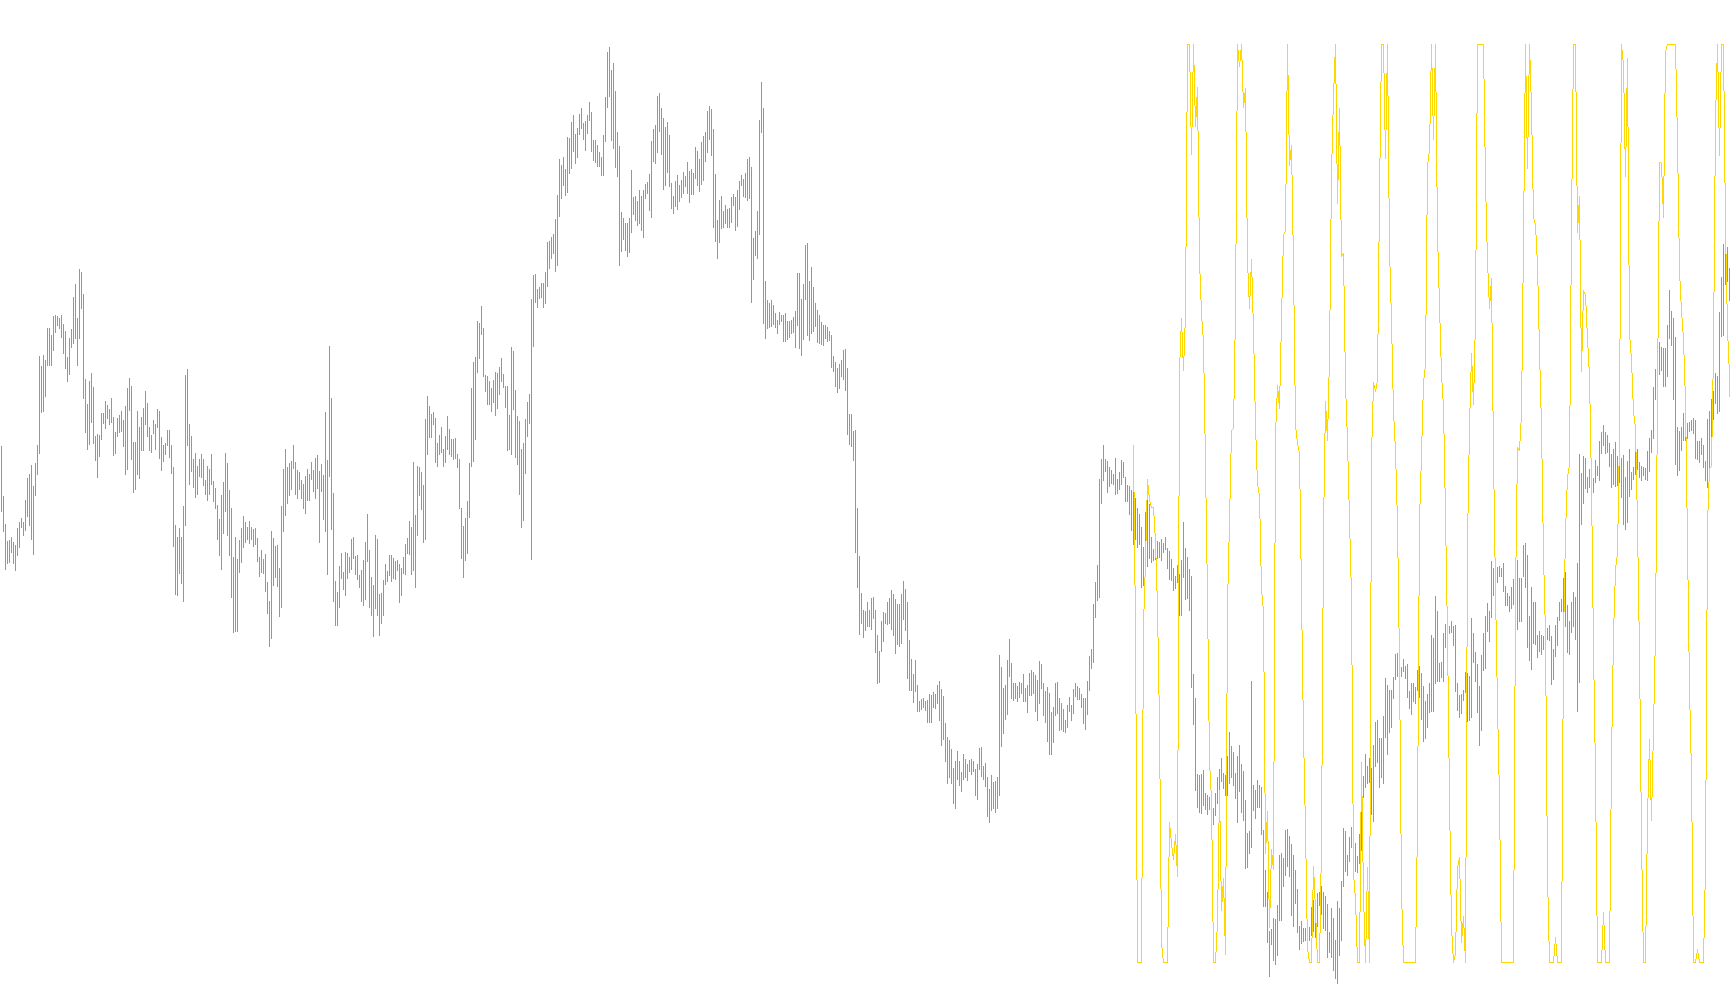
This tool is designed to analyze market activity by processing volume data through a specialized mathematical filter. Rather than looking at raw trading volume alone, it converts that data into a smoothed, relative momentum oscillator that helps traders visualize the "strength" or "velocity" of the current market movement.
Core Logic and Methodology
The script operates by breaking down the flow of information into several distinct stages:
1. Data Smoothing (The Laguerre Foundation) The tool begins by taking the raw volume of price bars and applying a smoothing technique based on a specific "Gamma" constant. This step prevents the indicator from reacting too erratically to sudden, isolated spikes in trading activity. It creates a baseline of smoothed volume values that represent a more stable trend of market participation.
2. Multi-Layered Momentum Calculation Instead of just calculating one value, the script processes the data through four different layers (L0 through L3). Each layer uses the previous results to determine a directional shift. By stacking these calculations, the tool creates a "memory" of recent price action, allowing it to distinguish between a brief moment of high volume and a sustained trend of increasing participation.
3. Relative Strength Identification Once the layers are calculated, the logic determines the difference between them. It compares the current state of the data against its previous states:
- If the values are increasing, the "Upward" component is measured.
- If the values are decreasing, the "Downward" component is measured.
4. Final Normalization (The Oscillator) The final output is a ratio between these Upward and Downward components. This results in a normalized value displayed on a scale (typically between 0 and 1).
Practical Interpretation for the User
By looking at the resulting line on your chart:
- High Values: Indicate that the momentum of volume is pushing strongly in an upward direction relative to recent history.
- Low Values: Indicate that the momentum of volume is shifting downward.
- The Trend: Because this is a smoothed indicator, it helps you see whether the "energy" behind a move is staying consistent or beginning to fade, providing a clearer picture of market sentiment than raw volume alone.
/*-----------------------------+
|			       |
| Shared by www.Aptrafx.com    |
|			       |
+------------------------------*/

//+-------------------------------------------------------------------------+
//| LaguerreVolume.mq4                                                      |
//| Emerald King, t_david                                                   |
//| http://finance.groups.yahoo.com/group/MetaTrader_Experts_and_Indicators |
//+-------------------------------------------------------------------------+

#property link      "http://finance.groups.yahoo.com/group/MetaTrader_Experts_and_Indicators"

#property indicator_separate_window
#property indicator_minimum -0.05
#property indicator_maximum 1.05
#property indicator_color1 Orange
#property indicator_level2 1.0
#property indicator_level3 0.75
#property indicator_level4 0.50
#property indicator_level5 0.25
#property indicator_level6 0.0

//---- input parameters
extern double gamma      = 0.618;
extern int    CountBars  = 300;

double L0   = 0;
double L1   = 0;
double L2   = 0;
double L3   = 0;
double L0A  = 0;
double L1A  = 0;
double L2A  = 0;
double L3A  = 0;
double LRSI = 0;
double CU   = 0;
double CD   = 0;

double val1[];
//+------------------------------------------------------------------+
//| Custom indicator initialization function                         |
//+------------------------------------------------------------------+
int init()
  {
//---- indicators
//----
   SetIndexBuffer(0,val1);
   return(0);
  }
//+------------------------------------------------------------------+
//| Custor indicator deinitialization function                       |
//+------------------------------------------------------------------+
int deinit()
  {
//---- TODO: add your code here

//----
   return(0);
  }
//+------------------------------------------------------------------+
//| Custom indicator iteration function                              |
//+------------------------------------------------------------------+
int start()
  {
   if (CountBars>Bars) CountBars=Bars;
   SetIndexDrawBegin(0,Bars-CountBars);

   int i;
   int    counted_bars=IndicatorCounted();

   i=CountBars-1;
   while(i>=0)
   {
      L0A = L0;
      L1A = L1;
      L2A = L2;
      L3A = L3;

      L0 = ((1 - gamma)*(Volume[i])) + (gamma*L0A);

      L1 = - gamma *L0 + L0A + gamma *L1A;
      L2 = - gamma *L1 + L1A + gamma *L2A;
      L3 = - gamma *L2 + L2A + gamma *L3A;

      CU = 0;
      CD = 0;

      if (L0 >= L1) CU = L0 - L1; else CD = L1 - L0;
      if (L1 >= L2) CU = CU + L1 - L2; else CD = CD + L2 - L1;
      if (L2 >= L3) CU = CU + L2 - L3; else CD = CD + L3 - L2;

      if (CU + CD != 0) LRSI = CU / (CU + CD);
      val1[i] = LRSI;
	  i--;
	}
   return(0);
 }
//+------------------------------------------------------------------+
Comments