LabTrend3_v1
Download script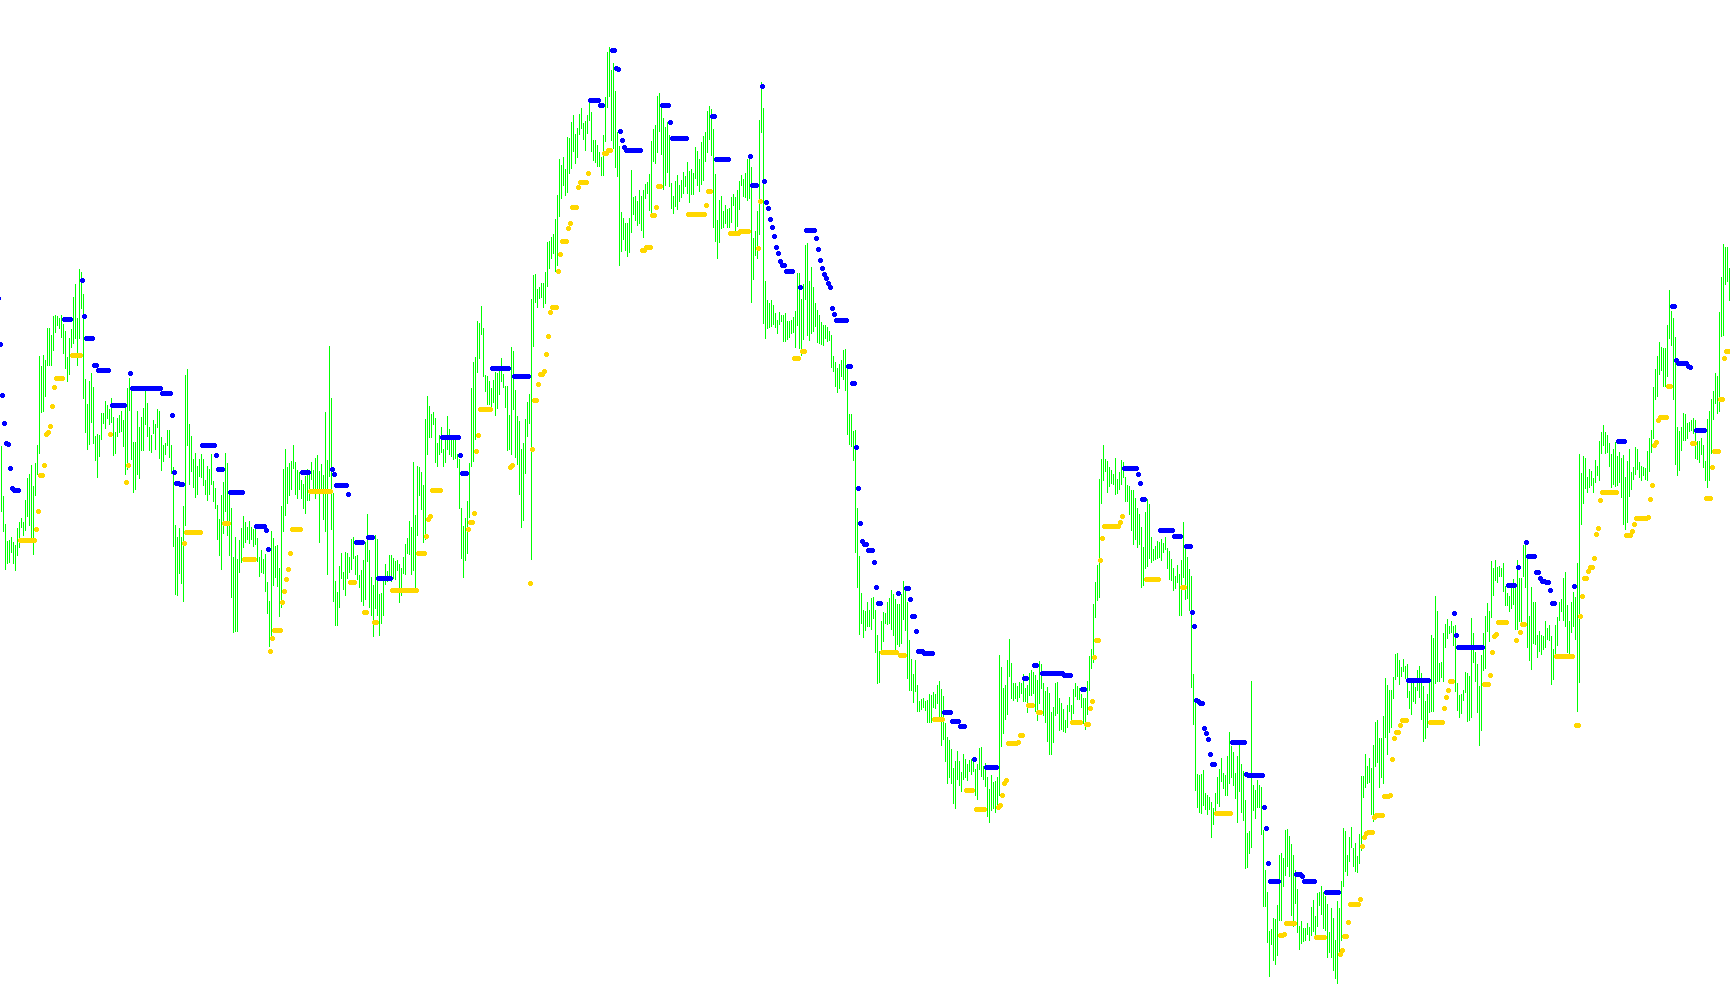
This tool is designed to identify and visualize potential trend reversals and structural price "stops" on a trading chart. Rather than simply following the current price movement, it calculates specific price boundaries that act as technical thresholds for upward and downward trends.
Core Logic Overview
The script functions by analyzing three primary components of market data: volatility, historical price extremes, and trend momentum. Here is how it processes that information:
1. Volatility Adjustment The tool first measures the current "breathing room" of the market (volatility). It compares short-term price fluctuations against a longer-term average. This ensures that the boundaries created by the script are mathematically relevant to the current market state—meaning they expand during high-activity periods and contract during quieter ones.
2. Structural Boundary Identification To determine where a trend might "break," the logic looks at recent historical highs and lows over a set number of bars. It uses these extremes to establish:
- Support Zones: Dynamic floor levels for upward trends.
- Resistance Zones: Dynamic ceiling levels for downward trends.
3. Trend Detection and Filtering The script continuously monitors whether the closing price has breached these calculated high or low boundaries.
- If the price breaks above a specific resistance point, the logic identifies an UpTrend.
- If the price falls below a specific support point, it identifies a DownTrend.
4. Dynamic Stop Tracking Once a trend is identified, the script doesn't just pick a static number; it "tracks" the boundary. It includes a trailing mechanism that ensures these boundaries only move in a direction that protects the trend (e.g., as an uptrend progresses, the support level moves upward but won't drop back down). This mimics how a trader might move a "stop-loss" order to lock in profits while the market moves in their favor.
Visual Output
The final result is displayed on your chart as specific markers (arrows/dots) representing:
- UpTrend Stops: The calculated price point where an upward movement might be considered invalidated or exhausted.
- DownTrend Stops: The calculated price point where a downward move might lose its momentum.
By combining these elements, the tool provides a visual guide to help traders distinguish between temporary market noise and significant structural shifts in price direction.
//+------------------------------------------------------------------+
//|                                                 LabTrend3_v1.mq4 |
//|                                  Copyright © 2006, Forex-TSD.com |
//|                         Written by IgorAD,igorad2003@yahoo.co.uk |
//|            http://finance.groups.yahoo.com/group/TrendLaboratory |
//+------------------------------------------------------------------+
#property copyright "Copyright © 2006, Forex-TSD.com "
#property link      "http://www.forex-tsd.com/"

#property indicator_chart_window
#property indicator_buffers 2
#property indicator_color1 Aqua
#property indicator_color2 Magenta
//---- input parameters

extern int    Risk=3;         // Sensivity Factor
extern double MoneyRisk=2.0; // Offset Factor
extern int    BarsNumber=1000;
//---- indicator buffers
double UpTrendBuffer[];
double DownTrendBuffer[];

//+------------------------------------------------------------------+
//| Custom indicator initialization function                         |
//+------------------------------------------------------------------+
  int init()
  {
   string short_name;
//---- indicator line

   SetIndexBuffer(0,UpTrendBuffer);
   SetIndexBuffer(1,DownTrendBuffer);

   SetIndexStyle(0,DRAW_ARROW);
   SetIndexStyle(1,DRAW_ARROW);

   SetIndexArrow(0,159);
   SetIndexArrow(1,159);

   IndicatorDigits(MarketInfo(Symbol(),MODE_DIGITS));
//---- name for DataWindow and indicator subwindow label
   short_name="LabTrend3("+Risk+","+MoneyRisk+")";
   IndicatorShortName(short_name);
   SetIndexLabel(0,"UpTrend Stop");
   SetIndexLabel(1,"DownTrend Stop");
//----
   SetIndexDrawBegin(0,10);
   SetIndexDrawBegin(1,10);
   SetIndexDrawBegin(2,10);
   SetIndexDrawBegin(3,10);
   SetIndexDrawBegin(4,10);
   SetIndexDrawBegin(5,10);
//----
   return(0);
  }

//+------------------------------------------------------------------+
//| LabTrend3_v1                                             |
//+------------------------------------------------------------------+
int start()
  {
   int    i,shift,trend;
   double Kv=0.382,smax[25000],smin[25000],bsmax[25000],bsmin[25000];

   int    Length=10;      // Volatility(ATR) Period
   int Nbars=BarsNumber+100;

   for (shift=Nbars;shift>=0;shift--)
   {
   UpTrendBuffer[shift]=0;
   DownTrendBuffer[shift]=0;
   }

   for (shift=Nbars-Length-100;shift>=0;shift--)
   {
     double Range=iATR(NULL,0,Length,shift);
     double AvgRange=iATR(NULL,0,100,shift);

     if (Range<AvgRange) Range=AvgRange;

     double high=High[Highest(NULL,0,MODE_HIGH,9,shift)];
     double low =Low[Lowest(NULL,0,MODE_LOW,9,shift)];

     smin[shift]=low + 0.3*(high-low);
     smax[shift]=high- 0.3*(high-low);

     bsmax[shift]=High[shift]+(1.0+0.1*Risk)*Range;
	  bsmin[shift]=Low[shift]-(1.0+0.1*Risk)*Range;

	  if(Close[shift]>smax[shift])  trend=1;
     if(Close[shift]<smin[shift])  trend=-1;

	  if(trend>0)
	  {
	  if(Low[shift]-bsmin[shift]<Kv*MoneyRisk*Range) bsmin[shift]=Low[shift]-Kv*MoneyRisk*Range;
	  if(bsmin[shift]<bsmin[shift+1]) bsmin[shift]=bsmin[shift+1];
	  }

	  if(trend<0)
	  {
	  if(bsmax[shift]-High[shift]<Kv*MoneyRisk*Range) bsmax[shift]=High[shift]+Kv*MoneyRisk*Range;
	  if(bsmax[shift]>bsmax[shift+1]) bsmax[shift]=bsmax[shift+1];
	  }

	  if (trend>0)
	  {
	     if (UpTrendBuffer[shift+1]==-1.0)
	     {
	     bsmin[shift]=Low[shift]-0.1*Risk*Range;
	     UpTrendBuffer[shift]=bsmin[shift];
	     }
	     else
	     {
	     UpTrendBuffer[shift]=bsmin[shift];
	     }
	  DownTrendBuffer[shift]=-1.0;
	  }
	  if (trend<0)
	  {
	  if (DownTrendBuffer[shift+1]==-1.0)
	     {
	     bsmax[shift]=High[shift]+0.1*Risk*Range;
	     DownTrendBuffer[shift]=bsmax[shift];
	     }
	     else
	     {
	     DownTrendBuffer[shift]=bsmax[shift];
	     }
	  UpTrendBuffer[shift]=-1.0;
	  }

	 }
	return(0);
 }
Comments