HOOL
Download script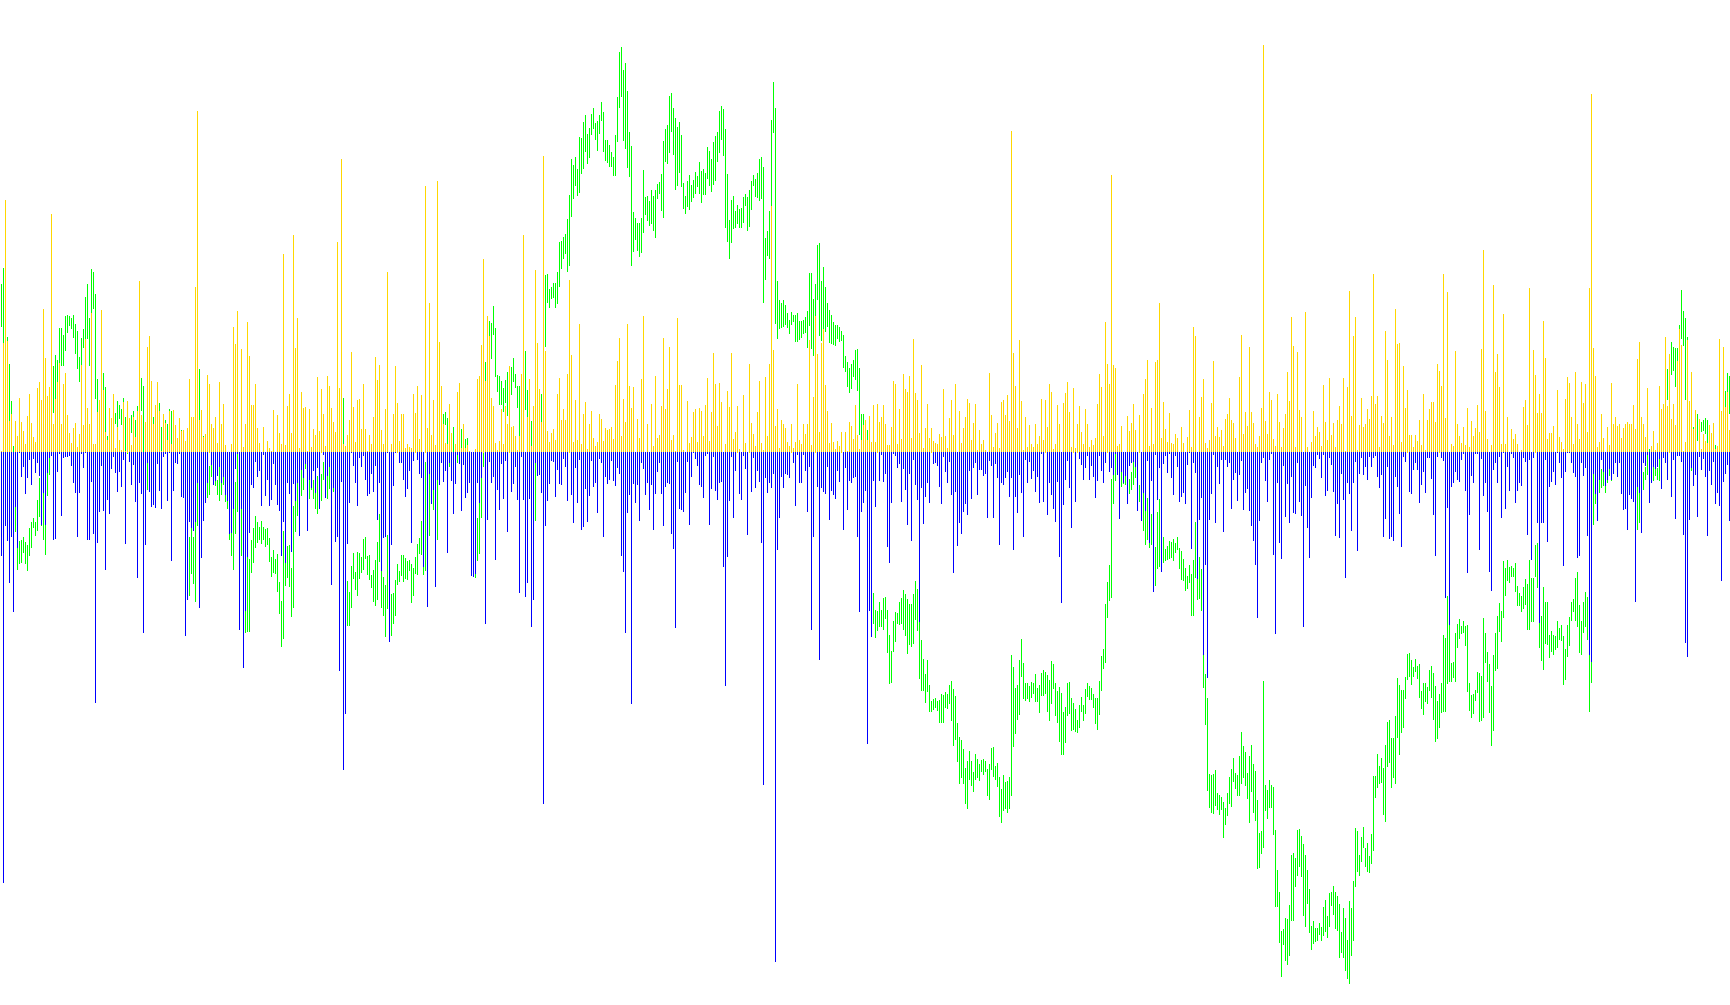
The HOOL indicator is a specialized visual tool designed for MetaTrader platforms to help traders monitor price action and market sentiment by measuring the relationship between current price movements and opening prices. Instead of tracking complex trends, this script focuses on "price distance"—specifically how far the price travels above or below the starting point of a specific timeframe.
Core Logic and Functionality
The tool operates by analyzing two primary data points for every candle on your chart: the highest price reached (High), the lowest price reached (Low), and the opening price (Open). It then calculates two distinct values to create a visual histogram:
- Upper Range (Green Movement): The script measures the distance from the opening price to the high of the candle. This represents the maximum upward momentum or "strength" achieved during that period.
- Lower Range (Red Movement): The script measures the distance from the opening price to the low of the candle. This represents the maximum downward pressure or "depth" reached during that same period.
Visual Representation
The indicator is displayed in a separate window below your main trading chart as a histogram. By converting these mathematical distances into visual bars, it allows you to see at a glance:
- Momentum Intensity: The height of the bars indicates how volatile or aggressive the price movement was relative to where it started.
- Price Balance: It provides a clear visual contrast between bullish (upward) and bearish (downward) reach within individual bars.
- Normalization: The logic includes a scaling factor to ensure that these measurements are accurately reflected based on the specific currency or asset's decimal precision, making the data consistent regardless of what you are trading.
Practical Use for Traders
For a non-technical user, this tool serves as a "volatility and range" map. Rather than looking at just the closing price, it highlights the "extremes" that occurred during each period. It allows you to quickly identify periods of significant expansion or contraction, helping you visualize the true boundaries of price movement beyond just the final numbers on your screen.
//+------------------------------------------------------------------+
//|                                                         HOOL.mq4 |
//|                                         Copyright © 2009, LeMan. |
//|                                                 b-market@mail.ru |
//+------------------------------------------------------------------+
#property  copyright "Copyright © 2009, LeMan."
#property  link      "b-market@mail.ru"
//----
#property  indicator_separate_window
#property  indicator_buffers 2
#property  indicator_color1  Green
#property  indicator_color2  Red
#property  indicator_width1  2
#property  indicator_width2  2
//----
double     ExtBuffer1[];
double     ExtBuffer2[];
//+------------------------------------------------------------------+
//| Custom indicator initialization function                         |
//+------------------------------------------------------------------+
int init() {
//----
   IndicatorBuffers(2);
   IndicatorDigits(Digits);
//----
   SetIndexBuffer(0,ExtBuffer1);
   SetIndexBuffer(1,ExtBuffer2);
//----
   SetIndexStyle(0,DRAW_HISTOGRAM);
   SetIndexStyle(1,DRAW_HISTOGRAM);
//----
   IndicatorShortName("HOOL");
//----
   return(0);
  }
//+------------------------------------------------------------------+
//| HOOL Indicator                                                   |
//+------------------------------------------------------------------+
int start() {
   int    limit, i;
   int    counted_bars = IndicatorCounted();
//----
   if (counted_bars > 0) counted_bars--;
   limit = Bars-counted_bars;
//----
   for (i = limit; i >= 0; i--) {
      ExtBuffer1[i] = NormalizeDouble((High[i]-Open[i])*MathPow(10,Digits),0);
      ExtBuffer2[i] = NormalizeDouble((Low[i]-Open[i])*MathPow(10,Digits),0);
   }
//----
   return(0);
}
//+------------------------------------------------------------------+
Comments