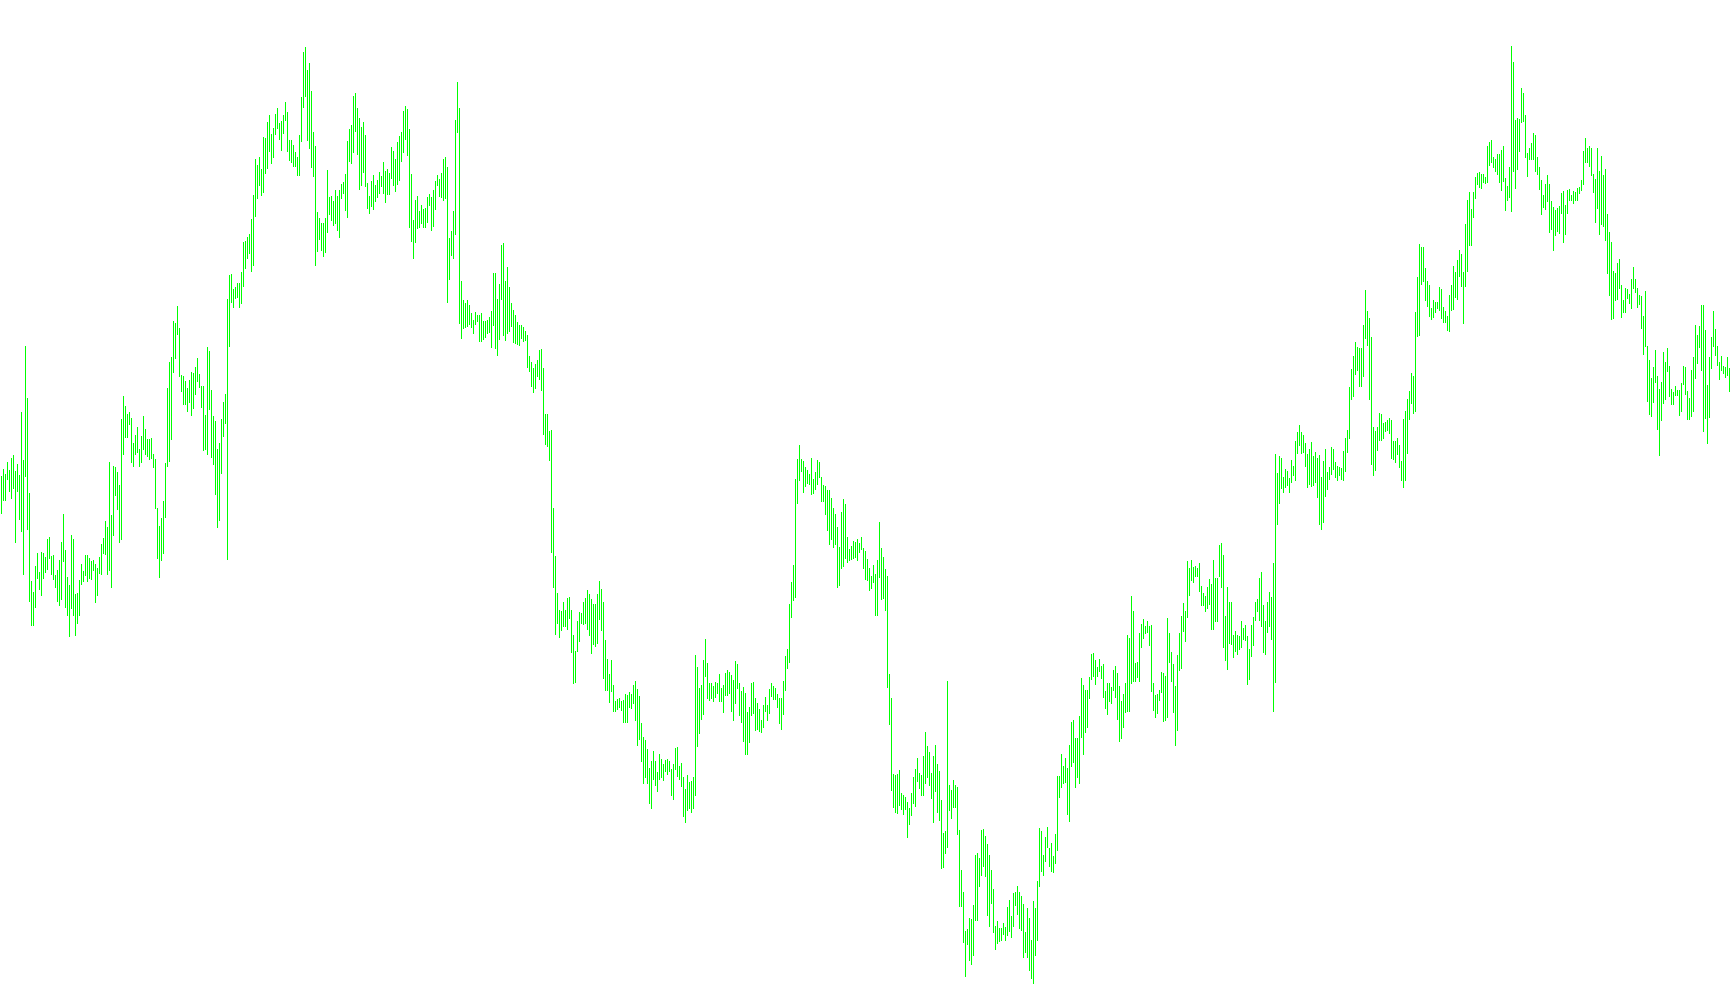
This script is a visual trading tool designed to identify and highlight significant structural peaks and valleys on a financial price chart. It functions by scanning historical price data to pinpoint specific areas where the market reached its highest and lowest points over a defined period.
How it Works
The logic operates by constantly monitoring a fixed window of "bars" (the vertical units on your chart) ahead of the current price. For every point in time, the script looks back at this specified range to determine two primary values:
- Local Highs: It identifies the highest price reached within that window.
- Local Lows: It identifies the lowest price reached within that window.
Visual Signals
Once these peaks and valleys are detected, the script places visual markers (arrows) on your chart to alert you to these specific turning points:
- Resistance Markers: When a point in time corresponds to a "highest" price in its surrounding area, an arrow is placed slightly above that peak. This highlights a ceiling where price momentum may have stalled.
- Support Markers: When a point in time corresponds to a "lowest" price in its surrounding area, an arrow is placed slightly below that trough. This highlights a floor where price momentum may have bottomed out.
Key Customizations
The behavior of these signals is governed by two main settings:
- The Detection Window: The script uses a fixed distance (set to 24 units) to determine how far back it looks to find these highs and lows. A larger window would identify more significant, long-term trend reversals, while a smaller window would focus on shorter, more immediate price fluctuations.
- The Signal Gap: To ensure that the visual arrows do not overlap with the actual candles (which can make the chart messy or hard to read), there is a built-in "gap." This pushes the markers a small, consistent distance away from the price candles so they remain clearly visible for the trader.
Summary for Traders
Essentially, this tool automates the process of identifying "swing highs" and "swing lows." Instead of manually searching for every peak and valley in a busy chart, the script highlights these structural points automatically, allowing you to more easily see where the market is reacting to key price levels.
//+------------------------------------------------------------------+
//|                                                super-signals.mq4 |
//|                Copyright © 2006, Nick Bilak, beluck[AT]gmail.com |
//+------------------------------------------------------------------+
#property copyright "Copyright © 2006, Nick Bilak"
#property link      "http://www.forex-tsd.com/"
//----
#property indicator_chart_window
#property indicator_buffers 2
#property indicator_color1 Red
#property indicator_color2 Aqua
//----
extern int SignalGap=10;
//----
int dist=24;
double b1[];
double b2[];
//+------------------------------------------------------------------+
//|                                                                  |
//+------------------------------------------------------------------+
  int init()
  {
   SetIndexStyle(0,DRAW_ARROW,STYLE_SOLID,1);
   SetIndexStyle(1,DRAW_ARROW,STYLE_SOLID,1);
   SetIndexArrow(1,233);
   SetIndexArrow(0,234);
   SetIndexBuffer(0,b1);
   SetIndexBuffer(1,b2);
   return(0);
  }
//+------------------------------------------------------------------+
//|                                                                  |
//+------------------------------------------------------------------+
  int start()
  {
   int counted_bars=IndicatorCounted();
   int k,i,j,limit,hhb,llb;
//----
   if (counted_bars<0) return(-1);
   if (counted_bars>0) counted_bars--;
   limit=Bars-1;
   if(counted_bars>=1) limit=Bars-counted_bars-1;
   if (limit<0) limit=0;
     for(i=limit;i>=0;i--)
     {
      hhb=Highest(NULL,0,MODE_HIGH,dist,i-dist/2);
      llb=Lowest(NULL,0,MODE_LOW,dist,i-dist/2);
//----
      if (i==hhb)
         b1[i]=High[hhb]+SignalGap*Point;
      if (i==llb)
         b2[i]=Low[llb]-SignalGap*Point;
     }
   return(0);
  }
//+------------------------------------------------------------------+
Comments