Heiken_Ashi
Download script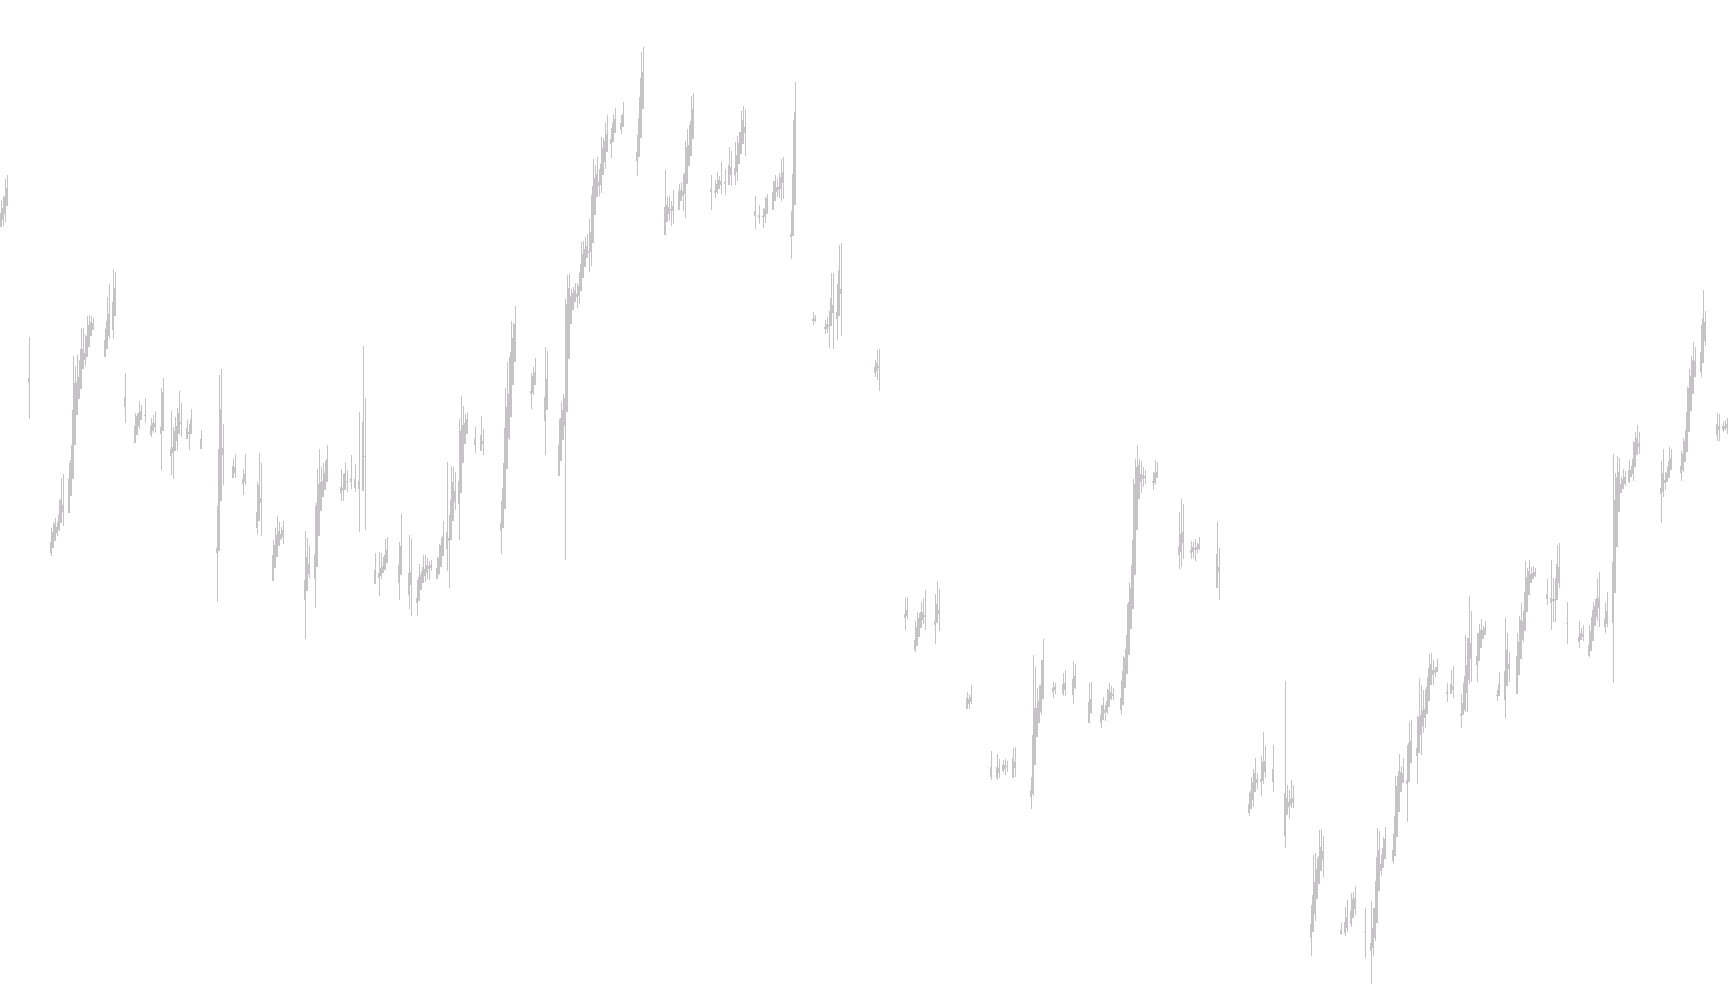
This script transforms standard price charts into Heikin Ashi candles, which are designed to smooth out price action and make it easier to identify underlying trends. Unlike traditional candlesticks that show raw price data, this tool recalculates the visual representation of each bar based on an average of previous movements.
How the Logic Works
The script processes each price bar by calculating four specific components:
- Opening Price: Instead of using the actual market open, it calculates a new opening value by taking the average of the previous candle's high and low points.
- Closing Price: It determines a new closing value by averaging the four standard price points of the current bar (Open, High, Low, and Close).
- High and Low Points: The script establishes the visual boundaries for each candle by comparing the actual market high and low against the newly calculated opening and closing values. This ensures that the "wick" or body of the candle remains consistent with the smoothed data.
Visual Rendering
Once these calculations are complete, the script determines how to draw the candles on your screen:
- If the calculated closing price is higher than the opening price, it renders a bullish candle structure.
- If the closing price is lower than the opening price, it renders a bearish candle structure.
User Experience
The tool automatically updates as new price data arrives. It is specifically designed to be used with certain chart settings (Line Graph mode) to ensure that the resulting Heikin Ashi bars appear correctly and provide a clear, filtered view of market momentum. This allows traders to see the "flow" of the trend rather than getting distracted by minor price fluctuations or "noise."
//+------------------------------------------------------------------+
//|                                                  Heiken Ashi.mq4 |
//|                      Copyright © 2004, MetaQuotes Software Corp. |
//|                                        http://www.metaquotes.net |
//+------------------------------------------------------------------+
//| For Heiken Ashi we recommend next chart settings ( press F8 or   |
//| select on menu 'Charts'->'Properties...'):                       |
//|  - On 'Color' Tab select 'Black' for 'Line Graph'                |
//|  - On 'Common' Tab disable 'Chart on Foreground' checkbox and    |
//|    select 'Line Chart' radiobutton                               |
//+------------------------------------------------------------------+
#property copyright "Copyright © 2004, MetaQuotes Software Corp."
#property link      "http://www.metaquotes.net"

#property indicator_chart_window
#property indicator_buffers 4
#property indicator_color1 Black
#property indicator_color2 Silver
#property indicator_color3 Black
#property indicator_color4 Silver
//---- buffers
double ExtMapBuffer1[];
double ExtMapBuffer2[];
double ExtMapBuffer3[];
double ExtMapBuffer4[];
//----
int ExtCountedBars=0;
//+------------------------------------------------------------------+
//| Custom indicator initialization function                         |
//|------------------------------------------------------------------|
int init()
  {
//---- indicators
   SetIndexStyle(0,DRAW_HISTOGRAM, 0, 1, Black);
   SetIndexBuffer(0, ExtMapBuffer1);
   SetIndexStyle(1,DRAW_HISTOGRAM, 0, 1, Silver);
   SetIndexBuffer(1, ExtMapBuffer2);
   SetIndexStyle(2,DRAW_HISTOGRAM, 0, 3, Black);
   SetIndexBuffer(2, ExtMapBuffer3);
   SetIndexStyle(3,DRAW_HISTOGRAM, 0, 3, Silver);
   SetIndexBuffer(3, ExtMapBuffer4);
//----
   SetIndexDrawBegin(0,10);
   SetIndexDrawBegin(1,10);
   SetIndexDrawBegin(2,10);
   SetIndexDrawBegin(3,10);
//---- indicator buffers mapping
   SetIndexBuffer(0,ExtMapBuffer1);
   SetIndexBuffer(1,ExtMapBuffer2);
   SetIndexBuffer(2,ExtMapBuffer3);
   SetIndexBuffer(3,ExtMapBuffer4);
//---- initialization done
   return(0);
  }
//+------------------------------------------------------------------+
//| Custor indicator deinitialization function                       |
//+------------------------------------------------------------------+
int deinit()
  {
//---- TODO: add your code here

//----
   return(0);
  }
//+------------------------------------------------------------------+
//| Custom indicator iteration function                              |
//+------------------------------------------------------------------+
int start()
  {
   double haOpen, haHigh, haLow, haClose;
   if(Bars<=10) return(0);
   ExtCountedBars=IndicatorCounted();
//---- check for possible errors
   if (ExtCountedBars<0) return(-1);
//---- last counted bar will be recounted
   if (ExtCountedBars>0) ExtCountedBars--;
   int pos=Bars-ExtCountedBars-1;
   while(pos>=0)
     {
      haOpen=(ExtMapBuffer3[pos+1]+ExtMapBuffer4[pos+1])/2;
      haClose=(Open[pos]+High[pos]+Low[pos]+Close[pos])/4;
      haHigh=MathMax(High[pos], MathMax(haOpen, haClose));
      haLow=MathMin(Low[pos], MathMin(haOpen, haClose));
      if (haOpen<haClose)
        {
         ExtMapBuffer1[pos]=haLow;
         ExtMapBuffer2[pos]=haHigh;
        }
      else
        {
         ExtMapBuffer1[pos]=haHigh;
         ExtMapBuffer2[pos]=haLow;
        }
      ExtMapBuffer3[pos]=haOpen;
      ExtMapBuffer4[pos]=haClose;
 	   pos--;
     }
//----

         Comment("\nHeiken Ashi Candles");

   return(0);
  }


//+------------------------------------------------------------------+
Comments