Figurelli Series
Download script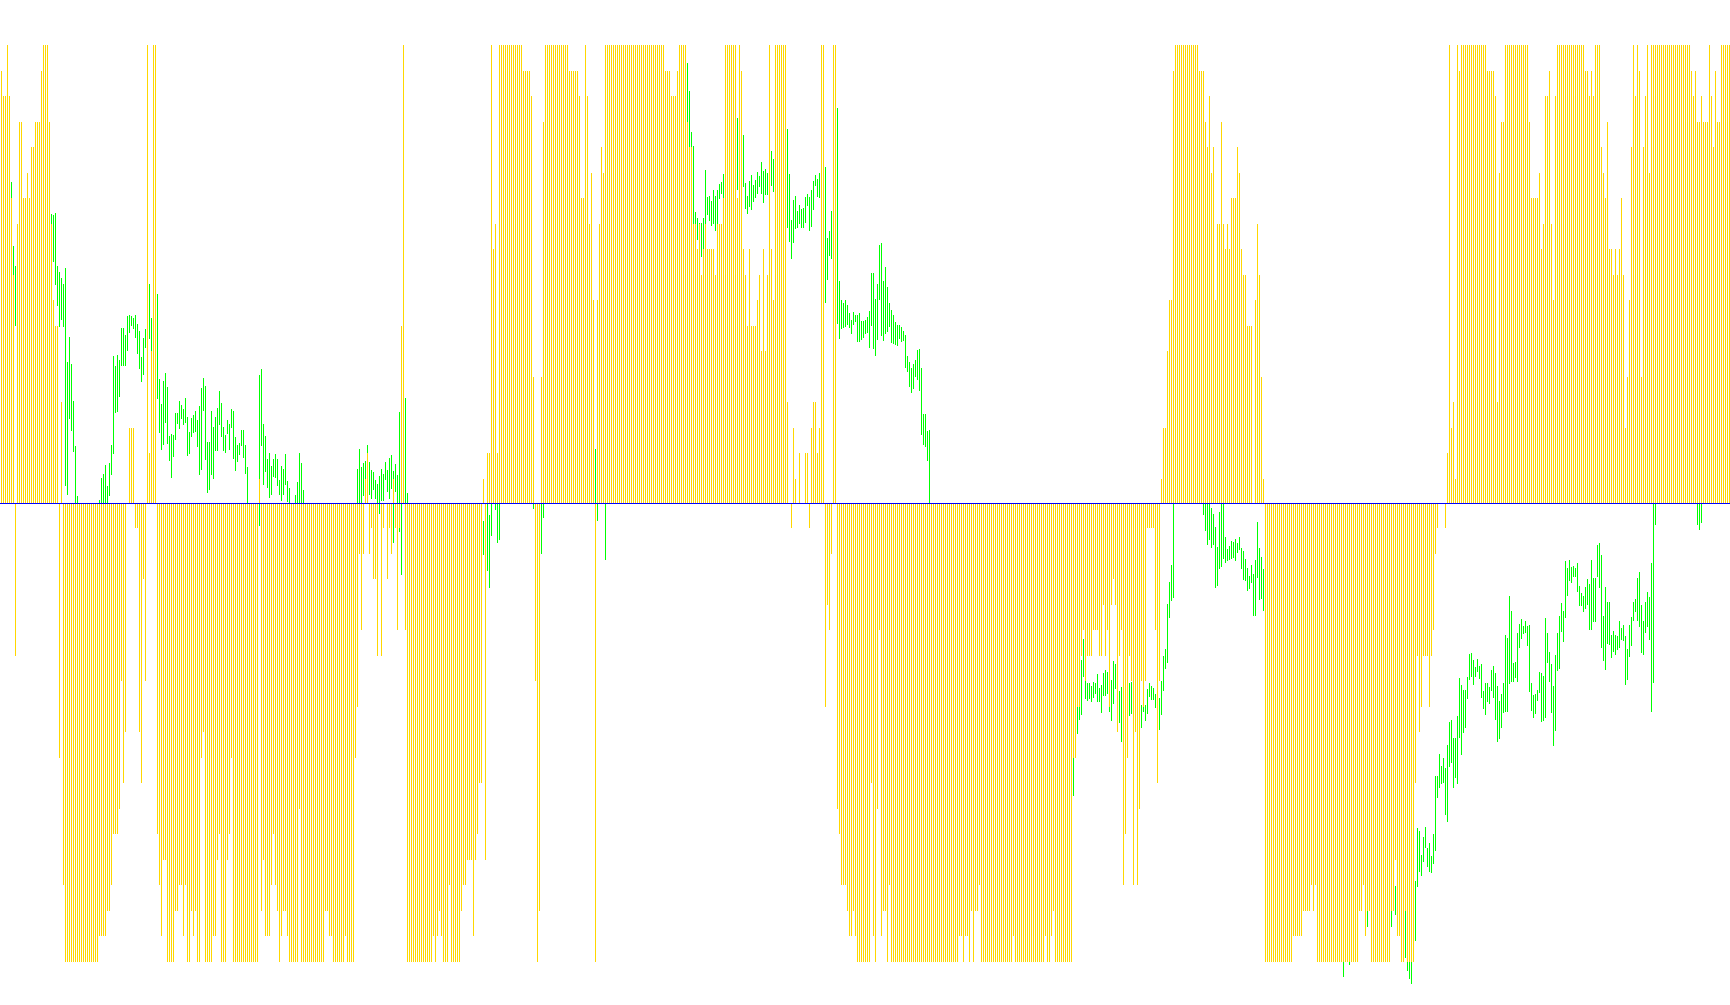
The Figurelli Series is a specialized technical analysis tool designed to help traders visualize and interpret market trends by evaluating the relationship between current price action and a multitude of moving averages simultaneously. Rather than relying on a single indicator, this script aggregates data from a series of different "time horizons" to provide a comprehensive overview of market momentum.
How the Logic Works
1. Multi-Layered Analysis The core logic of the indicator revolves around the creation of a "series." Instead of looking at just one average price point, the tool calculates 36 separate Simple Moving Averages (SMAs) at different intervals. By doing this, the script captures data from various timeframes—ranging from very short-term fluctuations to longer-term trends—all within a single view.
2. Momentum Scoring For every specific point in time on the chart, the script performs a systematic comparison:
- It checks where the current closing price sits in relation to each of the 36 moving averages.
- If the price is above a moving average, it registers as a bullish signal (a "Bid" point).
- If the price is below a moving average, it registers as a bearish signal (an "Ask" point).
3. Trend Quantification The indicator then performs a mathematical subtraction: it takes the total number of bullish signals and subtracts the total number of bearish signals. The result is a net score.
- A positive score indicates that the price is dominating more moving averages, suggesting stronger upward momentum.
- A negative score indicates the price is falling below a majority of the averages, suggesting downward pressure.
Visual Representation
The results are displayed in a separate window below the main price chart to keep the workspace clean:
- The Histogram: This visualizes the net score calculated by the logic. The height and direction of the bars allow you to see at a glance how strongly the trend is trending in either direction relative to the historical averages.
- Trend Summary: By observing the "weight" of these bars, traders can identify whether the market is in a state of equilibrium (where the score is near zero) or if there is a significant consensus among the various moving averages favoring a specific direction.
Key Takeaway for the User
The Figurelli Series acts as a "sentiment aggregator." It filters out the noise of individual price movements by checking how the current price performs against a broad spectrum of historical data points. This helps traders identify where the "mass" of the market trend is heading, providing a clearer picture of trend strength than any single moving average could offer on its own.
//+------------------------------------------------------------------+
//|                                             Figurelli Series.mq4 |
//|                                                Rogerio Figurelli |
//|                                      figurelli@quantafinance.com |
//+------------------------------------------------------------------+
//|                                                    QuantaFinance |
//|                                     http://www.quantafinance.com |
//+------------------------------------------------------------------+
//|                                       Figurelli Series Indicator |
//|                        calculates multiple moving averages trend |
//+------------------------------------------------------------------+
#property copyright "QuantaFinance"
#property link      "http://www.quantafinance.com"

// Version 2009-09-01

#property indicator_separate_window
#property indicator_buffers 2
#property indicator_color1 Red
#property indicator_color2 Black

//---- input parameters
extern int series=36; // number of series
extern int interval=6; // interval between series
extern int maxbars=1000;

//---- buffers
double Indicador[];
double Middle[];

//+------------------------------------------------------------------+
//| Custom indicator initialization function                         |
//+------------------------------------------------------------------+
int init()
{
   SetIndexStyle(0,DRAW_HISTOGRAM);
   SetIndexBuffer(0,Indicador);
   SetIndexStyle(1,DRAW_LINE);
   SetIndexBuffer(1,Middle);
   return(0);
}
//+------------------------------------------------------------------+
//| Custor indicator deinitialization function                       |
//+------------------------------------------------------------------+
int deinit()
{
   return(0);
}
//+------------------------------------------------------------------+
//| Custom indicator iteration function                              |
//+------------------------------------------------------------------+
int start()
{
   int i;
   int counted_bars=IndicatorCounted();
   double sma;
   int tot_Ask,tot_Bid,tot;

   if (counted_bars<0) return(-1);
   int limit=Bars-counted_bars;
   if (limit>maxbars) limit=maxbars;
   for (int shift=0; shift<=limit; shift++) {
      tot_Ask=0;
      tot_Bid=0;
      for (i=0; i<series; i++) {
         sma=iMA(NULL,0,interval+i*interval,8,MODE_SMA,PRICE_CLOSE,shift);
         if (Close[shift]<sma) tot_Ask++;
         if (Close[shift]>sma) tot_Bid++;
      }
      tot=tot_Bid-tot_Ask;
      Indicador[shift]=tot;
      Middle[shift]=0;
   }
   return(0);
}
//+------------------------------------------------------------------+
Comments