FiboPiv_Daily_DK_v1
Download script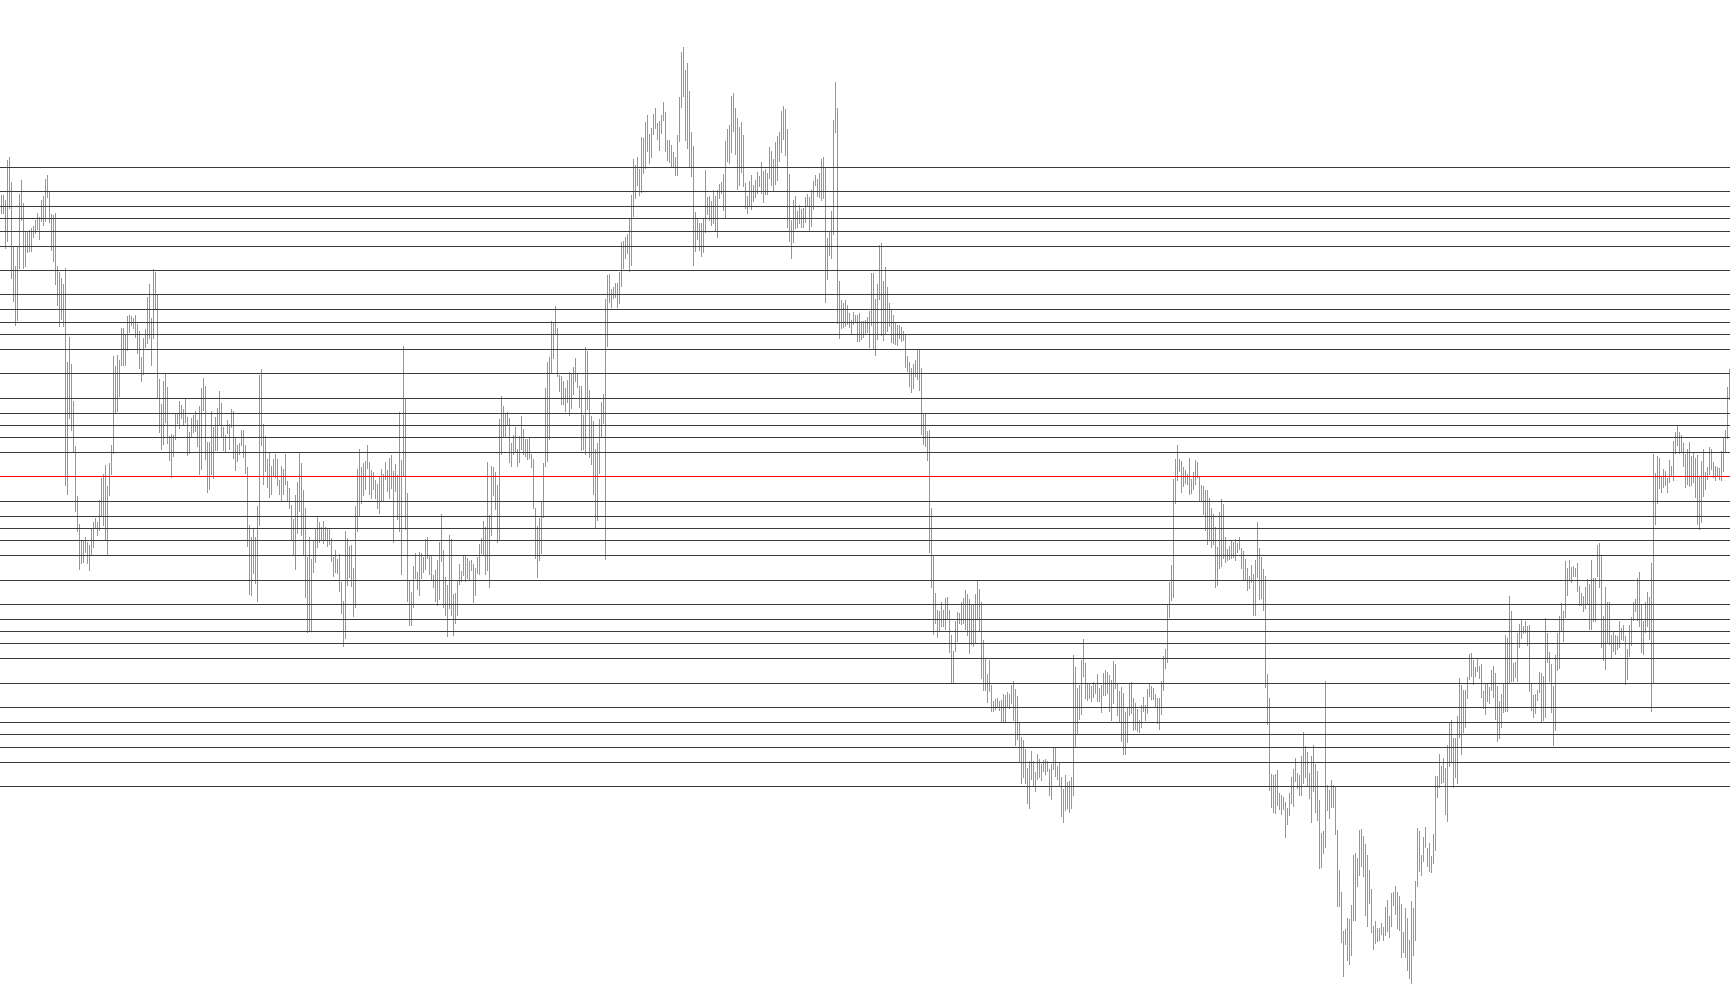
Technical Logic Overview: Daily Fibo Pivot Indicator
This script is designed to automate the calculation and visual mapping of specific price levels on a trading chart. It combines two popular technical analysis concepts—Pivot Points and Fibonacci Retracement levels—into a single, comprehensive daily display.
Core Functionality
The primary purpose of this script is to identify key "support" and "resistance" zones based on the previous day's price action. By automatically calculating these levels, it helps traders visualize potential areas where the market might encounter friction, reverse direction, or experience significant pullbacks.
How the Logic Works
1. Data Retrieval and Intelligence The script begins by looking at the historical data of the current trading symbol. It specifically identifies the high, low, and closing prices from the previous trading day.
- Weekend Handling: It contains specialized logic to ensure that if the market is currently open on a Monday, it correctly references the data from Friday rather than attempting to read the non-existent weekend data.
2. The Pivot Point Calculation Using the high, low, and close of the previous day, the script calculates a "Standard Pivot" point. This serves as the central baseline for the day's price action. Mathematically, it is derived by averaging these three key figures.
3. Fibonacci Integration Once the central Pivot Point and the daily range (the difference between the high and low) are established, the script calculates a series of 36 specific levels.
- Resistance Levels: These are calculated above the Pivot Point. They represent various "stretch" targets where price may face selling pressure.
- Support Levels: These are calculated below the Pivot Point. They represent "floor" areas where price may find buying interest.
- Variety of Intervals: The script maps out a wide array of Fibonacci ratios, ranging from standard levels (like 38.2% and 61.8%) to extended levels (up to 300%), providing a detailed map of potential market behavior.
4. Visual Rendering Instead of just performing the math in the background, the script actively manages the chart's visual interface:
- Dynamic Drawing: It automatically draws horizontal lines at every calculated price level.
- Automated Labeling: Every line is accompanied by a text label (e.g., "+FIB 61.8" or "-FIB 38.2") so the user can instantly identify which specific zone they are looking at.
- Clean Environment Management: The script includes a "cleanup" routine. When it is removed from the chart, it systematically deletes all the lines and labels it created to ensure the trading screen remains clean and uncluttered.
Summary for the User
Essentially, this tool takes the manual work out of plotting complex math. It looks at what happened yesterday, determines where the "gravity" centers are for today, and paints a comprehensive map of support and resistance zones on your chart automatically.
//+------------------------------------------------------------------+
//| Daily_FiboPiv_DK.mq4 |
//| Kalenzo |
//| bartlomiej.gorski@gmail.com |
//| upgrade by darkkiller |
//+------------------------------------------------------------------+
#property copyright "c. 2007-08, Kalenzo"
#property link "bartlomiej.gorski@gmail.com"
#property indicator_chart_window
//----
#property indicator_buffers 5
#property indicator_color1 C'62,62,62'
#property indicator_style1 1
#property indicator_color2 Red
#property indicator_style2 1
#property indicator_color3 C'62,62,62'
#property indicator_style3 1
#property indicator_color4 DarkGray
#property indicator_style4 1
#property indicator_color5 SlateGray
#property indicator_style5 1
/*
extern color Resistance_3 = Sienna;
extern color Resistance_2 = Red;
extern color Resistance_1 = Magenta;
extern color Pivot = Goldenrod;
extern color Support_1 = Lime;
extern color Support_2 = Green;
extern color Support_3 = DarkGreen;
*/
//+------------------------------------------------------------------+
//| Custom indicator initialization function |
//+------------------------------------------------------------------+
int init()
{
//---- indicators
return(0);
}
//+------------------------------------------------------------------+
//| Custom indicator deinitialization function |
//+------------------------------------------------------------------+
int deinit()
{
//----
ObjectDelete("S1");
ObjectDelete("S2");
ObjectDelete("S3");
ObjectDelete("S4");
ObjectDelete("S5");
ObjectDelete("S6");
ObjectDelete("S7");
ObjectDelete("S8");
ObjectDelete("S9");
ObjectDelete("S10");
ObjectDelete("S11");
ObjectDelete("S12");
ObjectDelete("S11");
ObjectDelete("S12");
ObjectDelete("S13");
ObjectDelete("S14");
ObjectDelete("S15");
ObjectDelete("S16");
ObjectDelete("S17");
ObjectDelete("S18");
//----
ObjectDelete("R1");
ObjectDelete("R2");
ObjectDelete("R3");
ObjectDelete("R4");
ObjectDelete("R5");
ObjectDelete("R6");
ObjectDelete("R7");
ObjectDelete("R8");
ObjectDelete("R9");
ObjectDelete("R10");
ObjectDelete("R11");
ObjectDelete("R12");
ObjectDelete("R11");
ObjectDelete("R12");
ObjectDelete("R13");
ObjectDelete("R14");
ObjectDelete("R15");
ObjectDelete("R16");
ObjectDelete("R17");
ObjectDelete("R18");
//----
ObjectDelete("PIVOT");
ObjectDelete(" Daily Pivot");
//----
ObjectDelete(" -FIB 23.6");
ObjectDelete(" -FIB 38.2");
ObjectDelete(" -FIB 50.0");
ObjectDelete(" -FIB 61.8");
ObjectDelete(" -FIB 76.4");
ObjectDelete(" -FIB 100.0");
ObjectDelete(" -FIB 123.6");
ObjectDelete(" -FIB 138.2");
ObjectDelete(" -FIB 150.0");
ObjectDelete(" -FIB 161.8");
ObjectDelete(" -FIB 176.4");
ObjectDelete(" -FIB 200.0");
ObjectDelete(" -FIB 223.6");
ObjectDelete(" -FIB 238.2");
ObjectDelete(" -FIB 250.0");
ObjectDelete(" -FIB 261.8");
ObjectDelete(" -FIB 276.4");
ObjectDelete(" -FIB 300.0");
//----
ObjectDelete(" +FIB 23.6");
ObjectDelete(" +FIB 38.2");
ObjectDelete(" +FIB 50.0");
ObjectDelete(" +FIB 61.8");
ObjectDelete(" +FIB 76.4");
ObjectDelete(" +FIB 100.0");
ObjectDelete(" +FIB 123.6");
ObjectDelete(" +FIB 138.2");
ObjectDelete(" +FIB 150.0");
ObjectDelete(" +FIB 161.8");
ObjectDelete(" +FIB 176.4");
ObjectDelete(" +FIB 200.0");
ObjectDelete(" +FIB 223.6");
ObjectDelete(" +FIB 238.2");
ObjectDelete(" +FIB 250.0");
ObjectDelete(" +FIB 261.8");
ObjectDelete(" +FIB 276.4");
ObjectDelete(" +FIB 300.0");
Comment(" ");
//----
return(0);
}
//+------------------------------------------------------------------+
//| Custom indicator iteration function |
//+------------------------------------------------------------------+
int start()
{
//----
double rates[1][6],yesterday_close,yesterday_high,yesterday_low;
ArrayCopyRates(rates, Symbol(), PERIOD_D1);
if(DayOfWeek()==1)
{
if(TimeDayOfWeek(iTime(Symbol(),PERIOD_D1,1))==5)
{
yesterday_close=rates[1][4];
yesterday_high=rates[1][3];
yesterday_low=rates[1][2];
}
else
{
for(int d=5;d>=0;d--)
{
if(TimeDayOfWeek(iTime(Symbol(),PERIOD_D1,d))==5)
{
yesterday_close=rates[d][4];
yesterday_high=rates[d][3];
yesterday_low=rates[d][2];
}
}
}
}
else
{
yesterday_close=rates[1][4];
yesterday_high=rates[1][3];
yesterday_low=rates[1][2];
}
//---- Calculate Pivots
Comment("");
double R=yesterday_high - yesterday_low;//range
double p=(yesterday_high + yesterday_low + yesterday_close)/3;// Standard Pivot
//----
double r18=p + (R * 3.000);
double r17=p + (R * 2.764);
double r16=p + (R * 2.618);
double r15=p + (R * 2.500);
double r14=p + (R * 2.382);
double r13=p + (R * 2.236);
double r12=p + (R * 2.000);
double r11=p + (R * 1.764);
double r10=p + (R * 1.618);
double r9=p + (R * 1.500);
double r8=p + (R * 1.382);
double r7=p + (R * 1.236);
double r6=p + (R * 1.000);
double r5=p + (R * 0.764);
double r4=p + (R * 0.618);
double r3=p + (R * 0.500);
double r2=p + (R * 0.382);
double r1=p + (R * 0.236);
//----
double s1=p - (R * 0.236);
double s2=p - (R * 0.382);
double s3=p - (R * 0.500);
double s4=p - (R * 0.618);
double s5=p - (R * 0.764);
double s6=p - (R * 1.000);
double s7=p - (R * 1.236);
double s8=p - (R * 1.382);
double s9=p - (R * 1.500);
double s10=p - (R * 1.618);
double s11=p - (R * 1.764);
double s12=p - (R * 2.000);
double s13=p - (R * 2.236);
double s14=p - (R * 2.382);
double s15=p - (R * 2.500);
double s16=p - (R * 2.618);
double s17=p - (R * 2.764);
double s18=p - (R * 3.000);
//----
drawLine(r18,"R18", indicator_color1,indicator_style1);
drawLabel(" +FIB 300.0",r18,indicator_color5);
drawLine(r17,"R17", indicator_color1,indicator_style1);
drawLabel(" +FIB 276.4",r17,indicator_color4);
drawLine(r16,"R16", indicator_color1,indicator_style1);
drawLabel(" +FIB 261.8",r16,indicator_color4);
drawLine(r15,"R15", indicator_color1,indicator_style1);
drawLabel(" +FIB 250.0",r15,indicator_color4);
drawLine(r14,"R14", indicator_color1,indicator_style1);
drawLabel(" +FIB 238.2",r14,indicator_color4);
drawLine(r13,"R13", indicator_color1,indicator_style1);
drawLabel(" +FIB 223.6",r13,indicator_color4);
drawLine(r12,"R12", indicator_color1,indicator_style1);
drawLabel(" +FIB 200.0",r12,indicator_color5);
drawLine(r11,"R11", indicator_color1,indicator_style1);
drawLabel(" +FIB 176.4",r11,indicator_color4);
drawLine(r10,"R10", indicator_color1,indicator_style1);
drawLabel(" +FIB 161.8",r10,indicator_color4);
drawLine(r9,"R9", indicator_color1,indicator_style1);
drawLabel(" +FIB 150.0",r9,indicator_color4);
drawLine(r8,"R8", indicator_color1,indicator_style1);
drawLabel(" +FIB 138.2",r8,indicator_color4);
drawLine(r7,"R7", indicator_color1,indicator_style1);
drawLabel(" +FIB 123.6",r7,indicator_color4);
drawLine(r6,"R6", indicator_color1,indicator_style1);
drawLabel(" +FIB 100.0",r6,indicator_color5);
drawLine(r5,"R5", indicator_color1,indicator_style1);
drawLabel(" +FIB 76.4",r5,indicator_color4);
drawLine(r4,"R4", indicator_color1,indicator_style1);
drawLabel(" +FIB 61.8",r4,indicator_color4);
drawLine(r3,"R3", indicator_color1,indicator_style1);
drawLabel(" +FIB 50.0",r3,indicator_color4);
drawLine(r2,"R2", indicator_color1,indicator_style1);
drawLabel(" +FIB 38.2",r2,indicator_color4);
drawLine(r1,"R1", indicator_color1,indicator_style1);
drawLabel(" +FIB 23.6",r1,indicator_color4);
//----
drawLine(p,"PIVOT",indicator_color2,indicator_style1);
drawLabel(" Daily Pivot",p,indicator_color2);
//----
drawLine(s1,"S1",indicator_color3,indicator_style1);
drawLabel(" -FIB 23.6",s1,indicator_color4);
drawLine(s2,"S2",indicator_color3,indicator_style1);
drawLabel(" -FIB 38.2",s2,indicator_color4);
drawLine(s3,"S3",indicator_color3,indicator_style1);
drawLabel(" -FIB 50.0",s3,indicator_color4);
drawLine(s4,"S4",indicator_color3,indicator_style1);
drawLabel(" -FIB 61.8",s4,indicator_color4);
drawLine(s5,"S5",indicator_color3,indicator_style1);
drawLabel(" -FIB 76.4",s5,indicator_color4);
drawLine(s6,"S6",indicator_color3,indicator_style1);
drawLabel(" -FIB 100.0",s6,indicator_color5);
drawLine(s7,"S7",indicator_color3,indicator_style1);
drawLabel(" -FIB 123.6",s7,indicator_color4);
drawLine(s8,"S8",indicator_color3,indicator_style1);
drawLabel(" -FIB 138.2",s8,indicator_color4);
drawLine(s9,"S9",indicator_color3,indicator_style1);
drawLabel(" -FIB 150.0",s9,indicator_color4);
drawLine(s10,"S10",indicator_color3,indicator_style1);
drawLabel(" -FIB 161.8",s10,indicator_color4);
drawLine(s11,"S11",indicator_color3,indicator_style1);
drawLabel(" -FIB 176.4",s11,indicator_color4);
drawLine(s12,"S12",indicator_color3,indicator_style1);
drawLabel(" -FIB 200.0",s12,indicator_color5);
drawLine(s13,"S13",indicator_color3,indicator_style1);
drawLabel(" -FIB 223.6",s13,indicator_color4);
drawLine(s14,"S14",indicator_color3,indicator_style1);
drawLabel(" -FIB 238.2",s14,indicator_color4);
drawLine(s15,"S15",indicator_color3,indicator_style1);
drawLabel(" -FIB 250.0",s15,indicator_color4);
drawLine(s16,"S16",indicator_color3,indicator_style1);
drawLabel(" -FIB 261.8",s16,indicator_color4);
drawLine(s17,"S17",indicator_color3,indicator_style1);
drawLabel(" -FIB 276.4",s17,indicator_color4);
drawLine(s18,"S18",indicator_color3,indicator_style1);
drawLabel(" -FIB 300.0",s18,indicator_color5);
//----
return(0);
}
//+------------------------------------------------------------------+
void drawLabel(string name,double lvl,color Color)
{
if(ObjectFind(name)!=0)
{
ObjectCreate(name, OBJ_TEXT, 0, Time[10], lvl);
ObjectSetText(name, name, 8, "Arial", EMPTY);
ObjectSet(name, OBJPROP_COLOR, Color);
}
else
{
ObjectMove(name, 0, Time[10], lvl);
}
}
//+------------------------------------------------------------------+
//| |
//+------------------------------------------------------------------+
void drawLine(double lvl,string name, color Col,int type)
{
if(ObjectFind(name)!=0)
{
ObjectCreate(name, OBJ_HLINE, 0, Time[0], lvl,Time[0],lvl);
if(type==1)
ObjectSet(name, OBJPROP_STYLE, STYLE_SOLID);
else if(type==2)
ObjectSet(name, OBJPROP_STYLE, STYLE_DASHDOTDOT);
else
ObjectSet(name, OBJPROP_STYLE, STYLE_DOT);
ObjectSet(name, OBJPROP_COLOR, Col);
ObjectSet(name,OBJPROP_WIDTH,1);
}
else
{
ObjectDelete(name);
ObjectCreate(name, OBJ_HLINE, 0, Time[0], lvl,Time[0],lvl);
if(type==1)
ObjectSet(name, OBJPROP_STYLE, STYLE_SOLID);
else if(type==2)
ObjectSet(name, OBJPROP_STYLE, STYLE_DASHDOTDOT);
else
ObjectSet(name, OBJPROP_STYLE, STYLE_DOT);
ObjectSet(name, OBJPROP_COLOR, Col);
ObjectSet(name,OBJPROP_WIDTH,1);
}
}
//+------------------------------------------------------------------+
Comments