Fibo_auto
Download script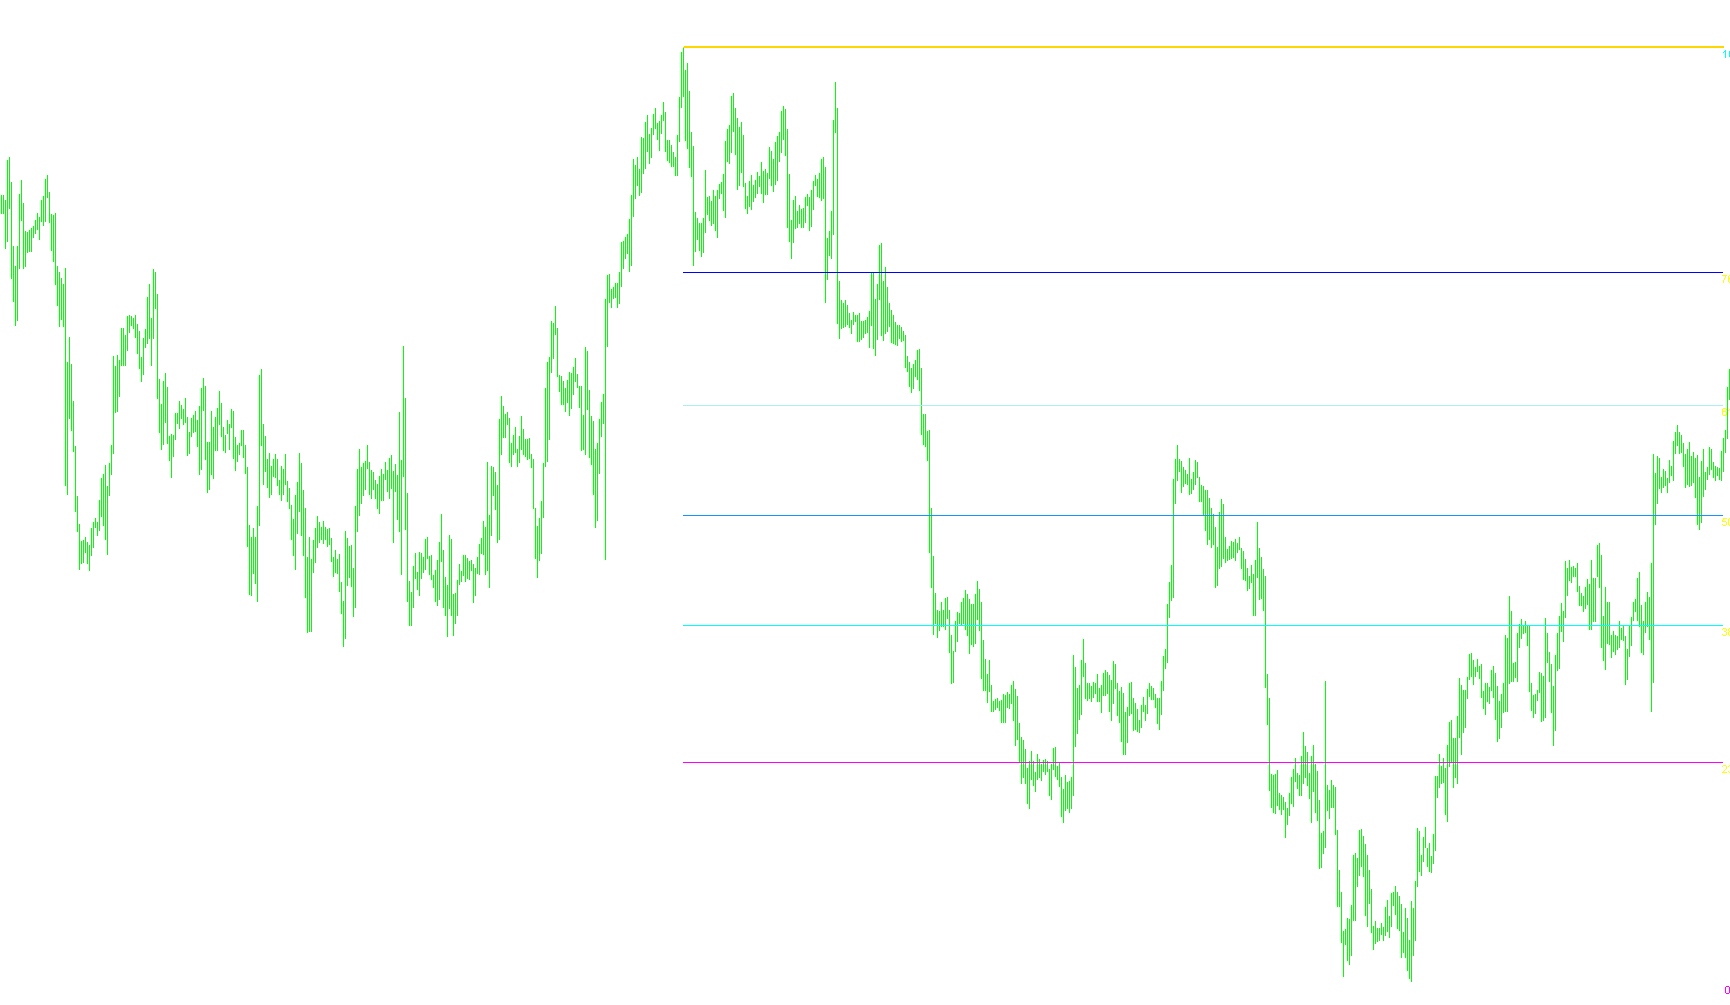
This script is designed as an automated technical analysis tool for the MetaTrader platform. Its primary purpose is to automatically identify and plot key Fibonacci retracement levels on a price chart based on historical price data. Instead of requiring a trader to manually select highs and lows to draw these lines, the script handles the calculations automatically.
Core Logic and Functionality
1. Data Range Selection The tool looks at a specific window of historical data (defined by a user-set number of days). It scans this period to find the highest price point and the lowest price point reached by the asset.
2. Automatic Level Calculation Once the script identifies the highest and lowest points within that timeframe, it calculates several standard Fibonacci ratios. These include key levels such as 23.6%, 38.2%, 50.0%, 61.8%, 76.0%, and the 0% and 100% boundaries. The script is smart enough to determine the direction of the price movement; it adjusts the math automatically whether the price moved from the bottom to the top or vice versa, ensuring the levels are drawn correctly relative to the trend.
3. Visual Representation The script draws seven distinct horizontal lines on your chart to represent these calculated levels. To make the chart easy to read, it also places text labels next to each line so you can immediately see which percentage level you are looking at.
4. Safety and Compatibility Filters To ensure accuracy, the tool includes a built-in check for timeframes. It will notify the user if they try to run it on a timeframe larger than one week (W1), as the specific calculations used by this script require higher precision than a weekly view can provide.
5. Real-Time Alerts One of the most practical features of this script is its alert system. The tool constantly monitors the current live price. If the market price touches or crosses any of the calculated Fibonacci levels, the script will trigger an audible alert and a notification on your screen. This allows traders to react instantly to significant "support" or "resistance" zones without having to watch the chart every second.
6. Efficiency The script is designed to update dynamically. It refreshes its calculations as new data comes in and ensures that the labels and lines remain pinned to their correct price positions even as the market moves forward.
//+------------------------------------------------------------------+
//|                                                    Fibo_auto.mq4 |
//|                                         Copyright © 2007, Xupypr |
//+------------------------------------------------------------------+
#property copyright "Copyright © 2007, Xupypr"

#property indicator_chart_window
#property indicator_buffers 7
#property indicator_color1 Aqua
#property indicator_color2 Yellow
#property indicator_color3 Yellow
#property indicator_color4 Yellow
#property indicator_color5 Yellow
#property indicator_color6 Yellow
#property indicator_color7 Magenta
//---- input parameters
extern int Days=35; // êîëëè÷åñòâî äíåé äëÿ ðàñ÷¸òà

int AllBars,DW;
double F[7],Level;
//---- indicator buffers
double ExtMapBuffer1[];
double ExtMapBuffer2[];
double ExtMapBuffer3[];
double ExtMapBuffer4[];
double ExtMapBuffer5[];
double ExtMapBuffer6[];
double ExtMapBuffer7[];

//+------------------------------------------------------------------+
//| Custom indicator initialization function |
//+------------------------------------------------------------------+
int init()
{
 SetIndexBuffer(0, ExtMapBuffer1);
 SetIndexStyle(0, DRAW_LINE, 0, 2);
 SetIndexLabel(0,"Óðîâåíü 100%");
 SetIndexBuffer(1, ExtMapBuffer2);
 SetIndexStyle(1, DRAW_LINE, 0, 1);
 SetIndexLabel(1,"Óðîâåíü 76.0%");
 SetIndexBuffer(2, ExtMapBuffer3);
 SetIndexStyle(2, DRAW_LINE, 0, 1);
 SetIndexLabel(2,"Óðîâåíü 61.8%");
 SetIndexBuffer(3, ExtMapBuffer4);
 SetIndexStyle(3, DRAW_LINE, 0, 1);
 SetIndexLabel(3,"Óðîâåíü 50.0%");
 SetIndexBuffer(4, ExtMapBuffer5);
 SetIndexStyle(4, DRAW_LINE, 0, 1);
 SetIndexLabel(4,"Óðîâåíü 38.2%");
 SetIndexBuffer(5, ExtMapBuffer6);
 SetIndexStyle(5, DRAW_LINE, 0, 1);
 SetIndexLabel(5,"Óðîâåíü 23.6%");
 SetIndexBuffer(6, ExtMapBuffer7);
 SetIndexStyle(6, DRAW_LINE, 0, 2);
 SetIndexLabel(6,"Óðîâåíü 0.0%");
 ObjectCreate("F0",OBJ_TEXT,0,Time[0]+180*Period(),0);
 ObjectSetText("F0","100%",8,"Arial",indicator_color1);
 ObjectCreate("F1",OBJ_TEXT,0,Time[0]+180*Period(),0);
 ObjectSetText("F1","76.0%",8,"Arial",indicator_color2);
 ObjectCreate("F2",OBJ_TEXT,0,Time[0]+180*Period(),0);
 ObjectSetText("F2","61.8%",8,"Arial",indicator_color3);
 ObjectCreate("F3",OBJ_TEXT,0,Time[0]+180*Period(),0);
 ObjectSetText("F3","50.0%",8,"Arial",indicator_color4);
 ObjectCreate("F4",OBJ_TEXT,0,Time[0]+180*Period(),0);
 ObjectSetText("F4","38.2%",8,"Arial",indicator_color5);
 ObjectCreate("F5",OBJ_TEXT,0,Time[0]+180*Period(),0);
 ObjectSetText("F5","23.6%",8,"Arial",indicator_color6);
 ObjectCreate("F6",OBJ_TEXT,0,Time[0]+180*Period(),0);
 ObjectSetText("F6","0.0%",8,"Arial",indicator_color7);
 //---- indicator short name
 IndicatorShortName("Fibo_auto ("+Days+" days)");
 return(0);
}

//+------------------------------------------------------------------+
//| Custom indicator deinitialization function |
//+------------------------------------------------------------------+
int deinit()
{
 Comment("");
 for (int i=0;i<7;i++) if (ObjectFind("F"+i)!=-1) ObjectDelete("F"+i);
 return(0);
}

int start()
{
 if (Period()>PERIOD_D1)
 {
  Comment("WARNING: Invalid timeframe! Valid value < W1.");
  return(0);
 }

 if (TimeDayOfWeek(Time[0])!=DW)
 {
  int bar_high,bar_low,bar_end;
  double day_high;
  double day_low;
  int bars=Days*(PERIOD_D1/Period());

  bar_high=iHighest(NULL,0,MODE_HIGH,bars,0);
  day_high=High[bar_high];
  bar_low=iLowest(NULL,0,MODE_LOW,bars,0);
  day_low=Low[bar_low];
  if (bar_high<bar_low)
  {
   bar_end=bar_low;
   F[0]=day_low;
   F[1]=day_high-0.76*(day_high-day_low);
   F[2]=day_high-0.618*(day_high-day_low);
   F[3]=day_high-0.5*(day_high-day_low);
   F[4]=day_high-0.382*(day_high-day_low);
   F[5]=day_high-0.236*(day_high-day_low);
   F[6]=day_high;
  }
  else
  {
   bar_end=bar_high;
   F[0]=day_high;
   F[1]=day_low+0.76*(day_high-day_low);
   F[2]=day_low+0.618*(day_high-day_low);
   F[3]=day_low+0.5*(day_high-day_low);
   F[4]=day_low+0.382*(day_high-day_low);
   F[5]=day_low+0.236*(day_high-day_low);
   F[6]=day_low;
  }
  DW=TimeDayOfWeek(Time[0]);
 }
 int i,Limit;
 int counted_bars=IndicatorCounted();
 if (counted_bars>0) Limit=Bars-counted_bars-1; else Limit=bar_end;
 for (i=Limit;i>=0;i--)
 {
  ExtMapBuffer1[i]=NormalizeDouble(F[0],Digits);
  ExtMapBuffer2[i]=NormalizeDouble(F[1],Digits);
  ExtMapBuffer3[i]=NormalizeDouble(F[2],Digits);
  ExtMapBuffer4[i]=NormalizeDouble(F[3],Digits);
  ExtMapBuffer5[i]=NormalizeDouble(F[4],Digits);
  ExtMapBuffer6[i]=NormalizeDouble(F[5],Digits);
  ExtMapBuffer7[i]=NormalizeDouble(F[6],Digits);
 }
 if (AllBars!=Bars)
 {
  for (i=0;i<7;i++) ObjectMove("F"+i,0,Time[0]+180*Period(),F[i]);
  AllBars=Bars;
 }
 for (i=0;i<7;i++) if (High[0]>=F[i] && Low[0]<=F[i] && Level!=F[i])
 {
  Alert("Ïåðåñå÷åíèå óðîâíÿ ",ObjectDescription("F"+i)," - ",F[i]);
  Level=F[i];
 }
}
//+------------------------------------------------------------------+
Comments