ma_3MA_separation_P
Download script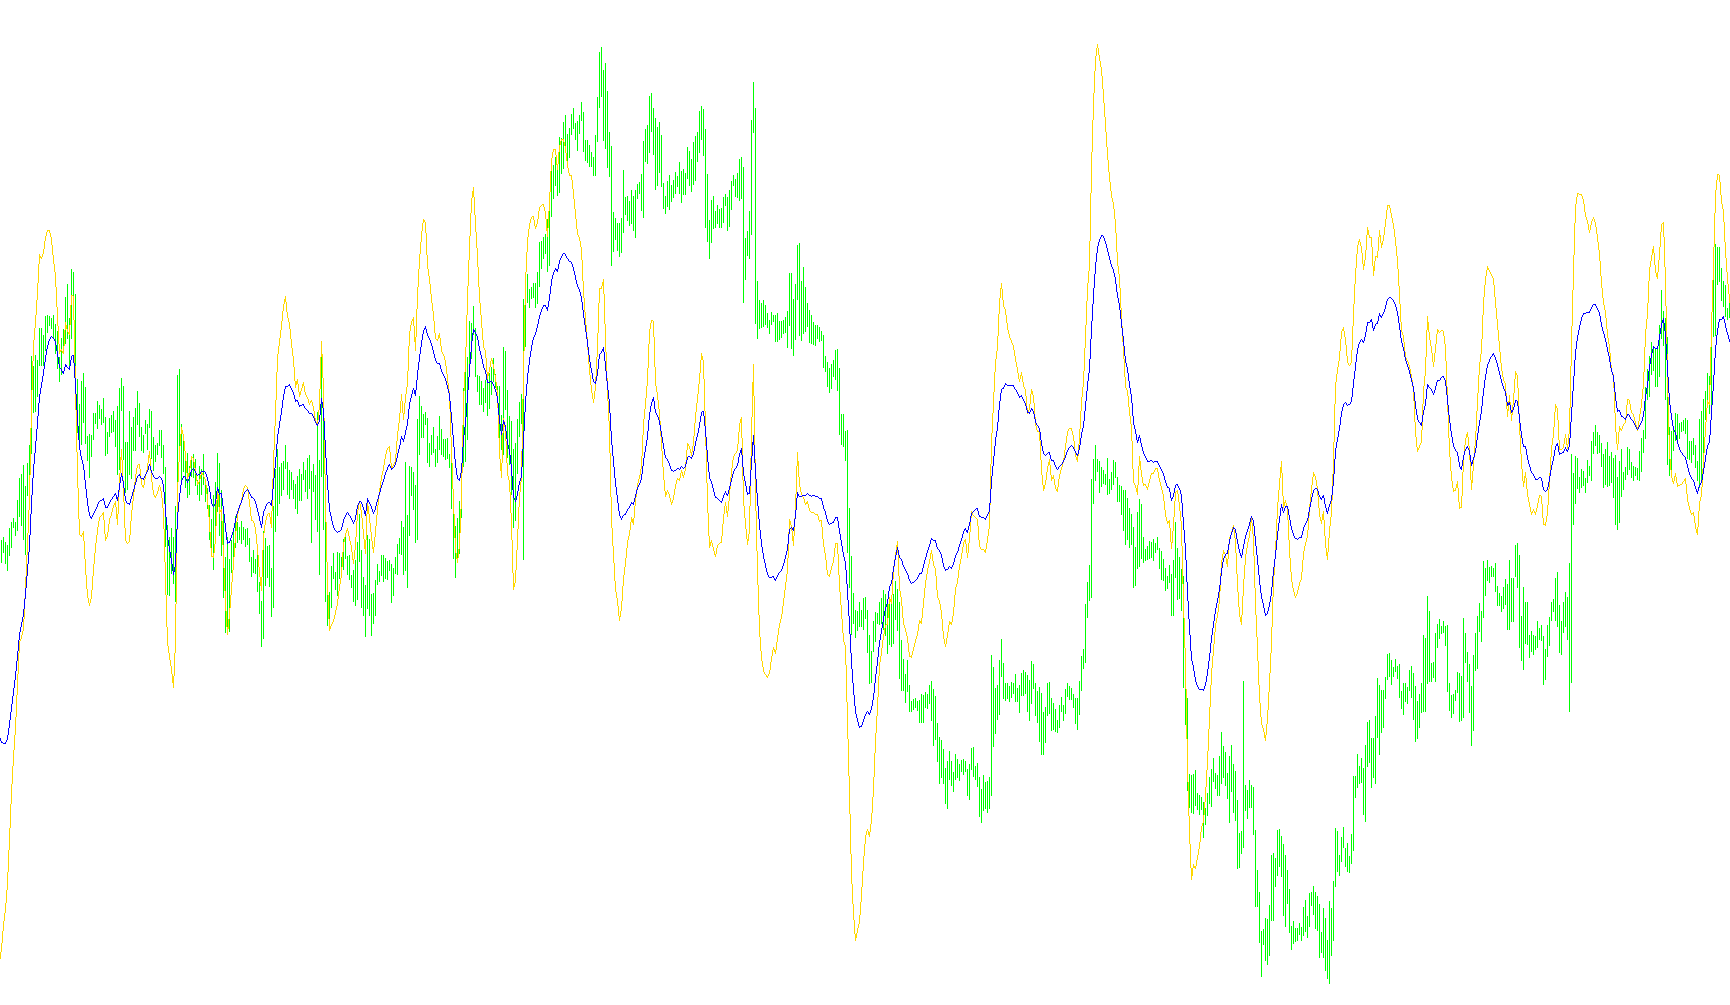
This tool is designed to help traders visualize the relationship between different moving averages by measuring their "separation" from a common baseline. Instead of looking at multiple lines overlapping on a price chart, this indicator isolates the distance between those lines to provide a clearer picture of market momentum and trend dynamics.
Core Logic and Functionality
The script operates by comparing two different moving averages against a third, longer-term moving average, which serves as the primary reference point (the anchor). Here is how that logic breaks down into three main components:
- The Reference Point: The tool uses a long-term moving average (defined by the user) as its base. This represents the broader, more stable trend of the market.
- Dual Separation Measurements: The indicator calculates two distinct values simultaneously:
- The distance between a short-term moving average and the long-term reference.
- The distance between a medium-term moving average and that same long-term reference.
- Normalization to Points: To make these distances readable and consistent across different currency pairs or assets, the script converts the raw price difference into "points." This allows for a standardized view of how far the current price action has drifted from the established trend.
Visual Interpretation
The tool outputs two separate lines on a dedicated indicator window:
- Green Line: Represents the separation of the first (shortest) moving average.
- Red Line: Represents the separation of the second (medium) moving average.
By observing these two lines, a trader can see how aggressively the price is pulling away from the long-term trend. When both lines move in the same direction and increase in distance, it suggests a strengthening trend. If the lines begin to converge or cross each other, it may signal that the current momentum is losing steam relative to the primary trend.
Customization Options
The logic allows for significant flexibility through several user-defined settings:
- Periods: Users can define the specific timeframe (length) for all three moving averages.
- Calculation Modes: The script supports different types of moving averages (such as Simple, Exponential, Smoothed, or Linear Weighted), allowing the user to choose how "smooth" or "reactive" they want the data to be.
- Price Source: Users can choose which price data to base the calculations on (e.g., the current price, the high of the candle, the low of the candle, etc.).
//http://www.kroufr.ru/forum/index.php/topic,7500.0.html#msg47579
//separation [quote =alexav link=topic=7500.msg47579#msg47579 date=1219499958]

#property indicator_separate_window
#property indicator_buffers 2
#property indicator_color1 Green
#property indicator_color2 Red

#property indicator_levelcolor MediumSlateBlue
#property indicator_levelstyle STYLE_DOT
#property indicator_level1 8
#property indicator_level2 -8
//#property indicator_minimum -20
//#property indicator_maximum 20

//---- buffers
extern int MAPeriod1=5;
extern int Mode1=1;
extern int Price1=0;

extern int MAPeriod2=11;
extern int Mode2=1;
extern int Price2=0;

extern int MAPeriod3=24;
extern int Mode3=1;
extern int Price3=0;

double IND1[];
double IND2[];

extern string note_MA_Mode  = "SMA0 EMA1 SMMA2 LWMA3";
extern string note_MA_Price = "0C 1O 2H 3L 4Md 5Tp 6WghC: Md(HL/2)4,Tp(HLC/3)5,Wgh(HLCC/4)6";

//+------------------------------------------------------------------+
//| Custom indicator initialization function                         |
//+------------------------------------------------------------------+
int init()
  {
//---- indicators
   IndicatorShortName("MA("+MAPeriod1+","+MAPeriod2+" / "+MAPeriod3+") Separation Points:");
   SetIndexStyle(0,DRAW_LINE);
   SetIndexBuffer(0,IND1);

   SetIndexStyle(1,DRAW_LINE);
   SetIndexBuffer(1,IND2);

   SetIndexLabel(0,"MA("+MAPeriod1+","+MAPeriod3+")SeP");
   SetIndexLabel(1,"MA("+MAPeriod2+","+MAPeriod3+")SeP:");

   //----

   return(0);
  }
//+------------------------------------------------------------------+
//| Custom indicator deinitialization function                       |
//+------------------------------------------------------------------+
int deinit()
  {
   return(0);
  }
//+------------------------------------------------------------------+
//| Custom indicator iteration function                              |
//+------------------------------------------------------------------+
int start()
  {
     int limit;
     int counted_bars=IndicatorCounted();
     if(counted_bars<0) return(-1);
     if(counted_bars>0) counted_bars--;
     limit=Bars-counted_bars;


     for(int i=0; i<limit; i++)
       {
        IND1[i]=(iMA(NULL,0,MAPeriod1,0,Mode1,Price1,i)-iMA(NULL,0,MAPeriod3,0,Mode3,Price3,i))*1/Point;
        IND2[i]=(iMA(NULL,0,MAPeriod2,0,Mode2,Price2,i)-iMA(NULL,0,MAPeriod3,0,Mode3,Price3,i))*1/Point;

       }
  //----
    return(0);
  }
//+------------------------------------------------------------------+
Comments