cross
Download script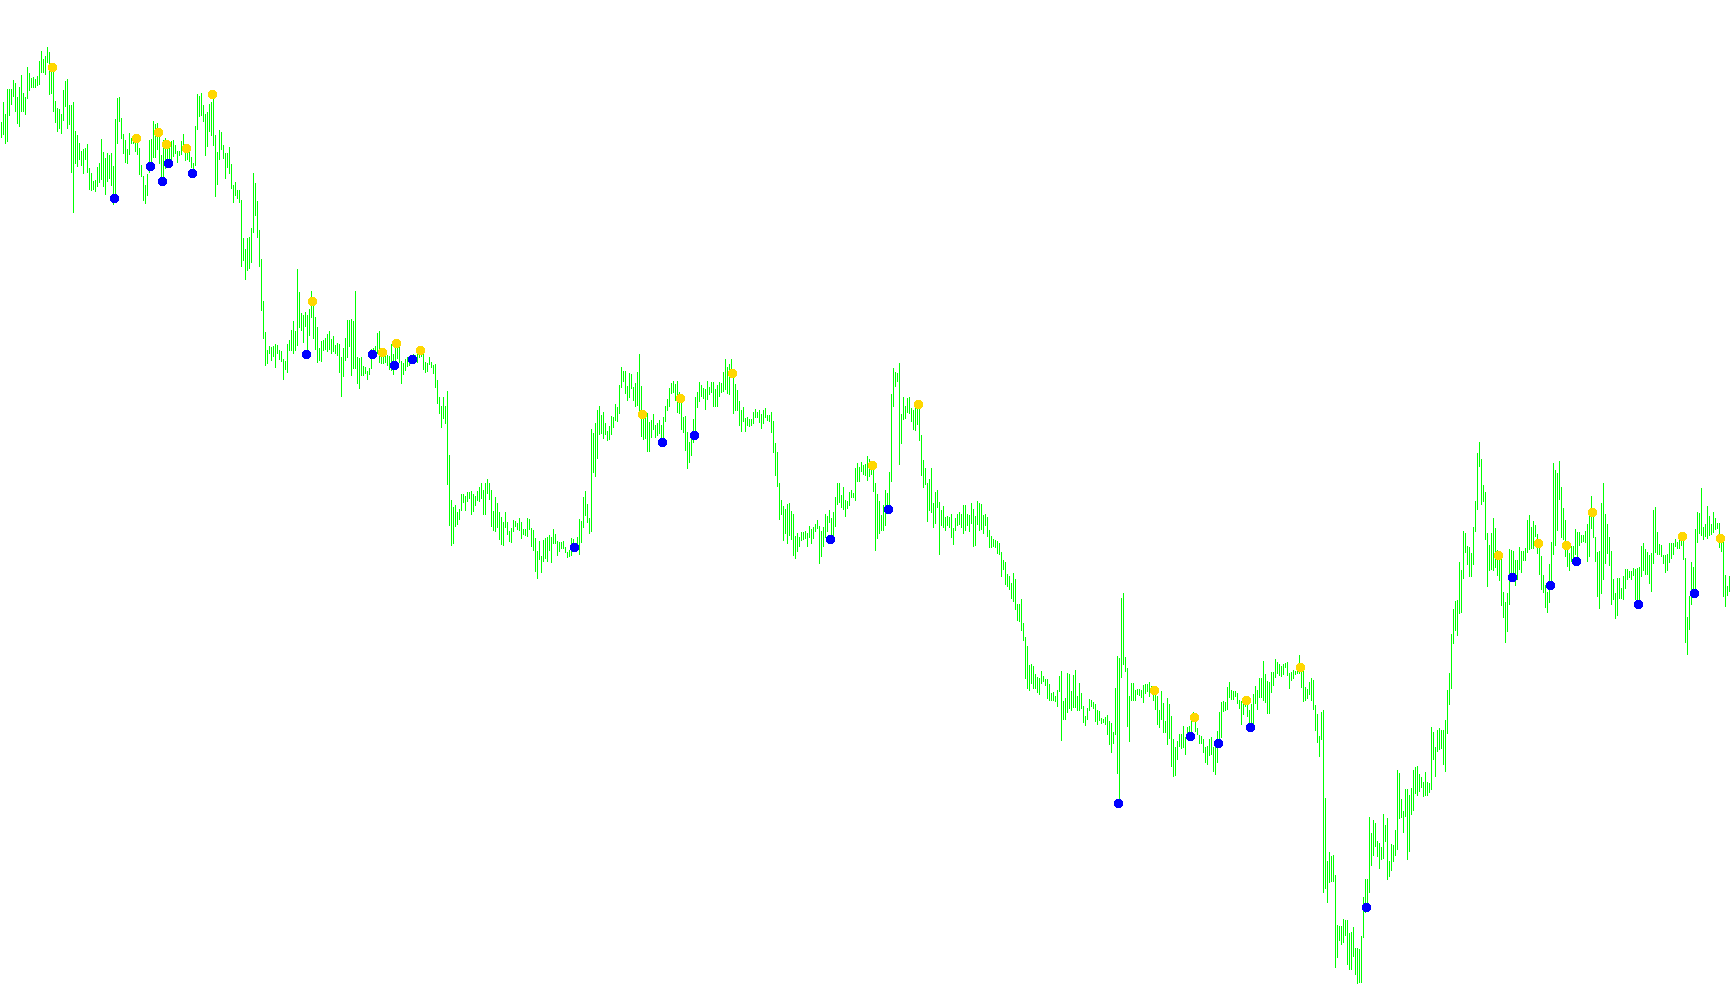
This trading tool is designed to identify specific momentum shifts in the market by monitoring the relationship between two different moving averages. By analyzing how these averages interact over time, the script highlights potential entry or exit points for traders.
Core Logic Overview
The indicator focuses on the "crossover" effect—a common technical analysis method where a fast-moving average intersects with a slower-moving average. To do this, the tool tracks two distinct lines:
- The Fast Period: A shorter timeframe that reacts quickly to recent price changes.
- The Slow Period: A longer timeframe that represents the broader, underlying trend of the market.
How It Works
The script constantly scans the price history to detect moments where these two lines cross paths. Instead of just showing you a line on your chart, this tool places visual markers (arrows) at the exact moment a crossover occurs:
- Bullish Signals (Upward Momentum): The tool looks for a situation where the Fast Period was previously below the Slow Period but has now crossed above it. When this happens, the script identifies an upward shift in momentum and places a marker at the top of the price candle.
- Bearish Signals (Downward Momentum): Conversely, the tool looks for instances where the Fast Period was previously above the Slow Period but has now dropped below it. When this occurs, it identifies a downward shift in momentum and places a marker at the bottom of the price candle.
Visual Representation
To make the data easy to read at a glance, the indicator uses two different colors to distinguish between these movements:
- Red Markers: These appear when the market shows signs of downward pressure (the fast line crossing below the slow line).
- Green Markers: These appear when the market shows signs of upward pressure (the fast line crossing above the slow line).
In summary, this tool automates the process of watching trend changes, filtering out the "noise" of minor price fluctuations to highlight only the significant moments where short-term momentum breaks away from the long-term trend.
/*[[
	Name := EMA Cross
	Author := Hapsa
	Link := http://www.metaquotes.net/
	Separate Window := No
	Separate Window := No
	First Color := Red
	First Draw Type := Symbol
	First Symbol := 108
	Use Second Data := Yes
	Second Color := DarkOliveGreen
	Second Draw Type := Symbol
	Second Symbol := 108
]]*/


#property copyright "Hapsa"
#property link      ""
extern int SlowPeriod=20;
extern int FastPeriod=5;

#property indicator_buffers 3
#property indicator_chart_window
#property indicator_color1 Red
#property indicator_color2 Green
double L20[];
double L50[];
double shift=0,val1=0,val2=0;

int init()
  {

IndicatorBuffers(3);
SetIndexStyle(0,DRAW_ARROW);
SetIndexStyle(1,DRAW_ARROW);

SetIndexArrow(0, 108);
SetIndexArrow(1, 108);

SetIndexBuffer(0,L20);
SetIndexBuffer(1,L50);


//---- indicators
//----
   return(0);
  }


int start()
  {


   int    counted_bars=IndicatorCounted();
//----
   int i = Bars - counted_bars - 1;
   while (i>=0)
   {

   val1=0;
	val2=0;

	double iMaSlowPrevious = iMA(NULL,0,SlowPeriod,0,MODE_EMA, PRICE_CLOSE, i-1);
	double iMaSlowCurrent = iMA(NULL,0,SlowPeriod,0,MODE_EMA, PRICE_CLOSE, i);
	double iMaFastPrevious = iMA(NULL,0,FastPeriod,0,MODE_EMA, PRICE_CLOSE, i-1);
	double iMaFastCurrent = iMA(NULL,0,FastPeriod,0,MODE_EMA, PRICE_CLOSE, i);

   if (iMaFastPrevious<iMaSlowPrevious && iMaFastCurrent>iMaSlowCurrent ) val1=High[i];
   if (iMaFastPrevious>iMaSlowPrevious && iMaFastCurrent<iMaSlowCurrent ) val2=Low[i];
    L20[i]=val1+5*Point;
    L50[i]=val2-5*Point;
     i--;
   }

//----
   return(0);
}
Comments