ADXm
Download script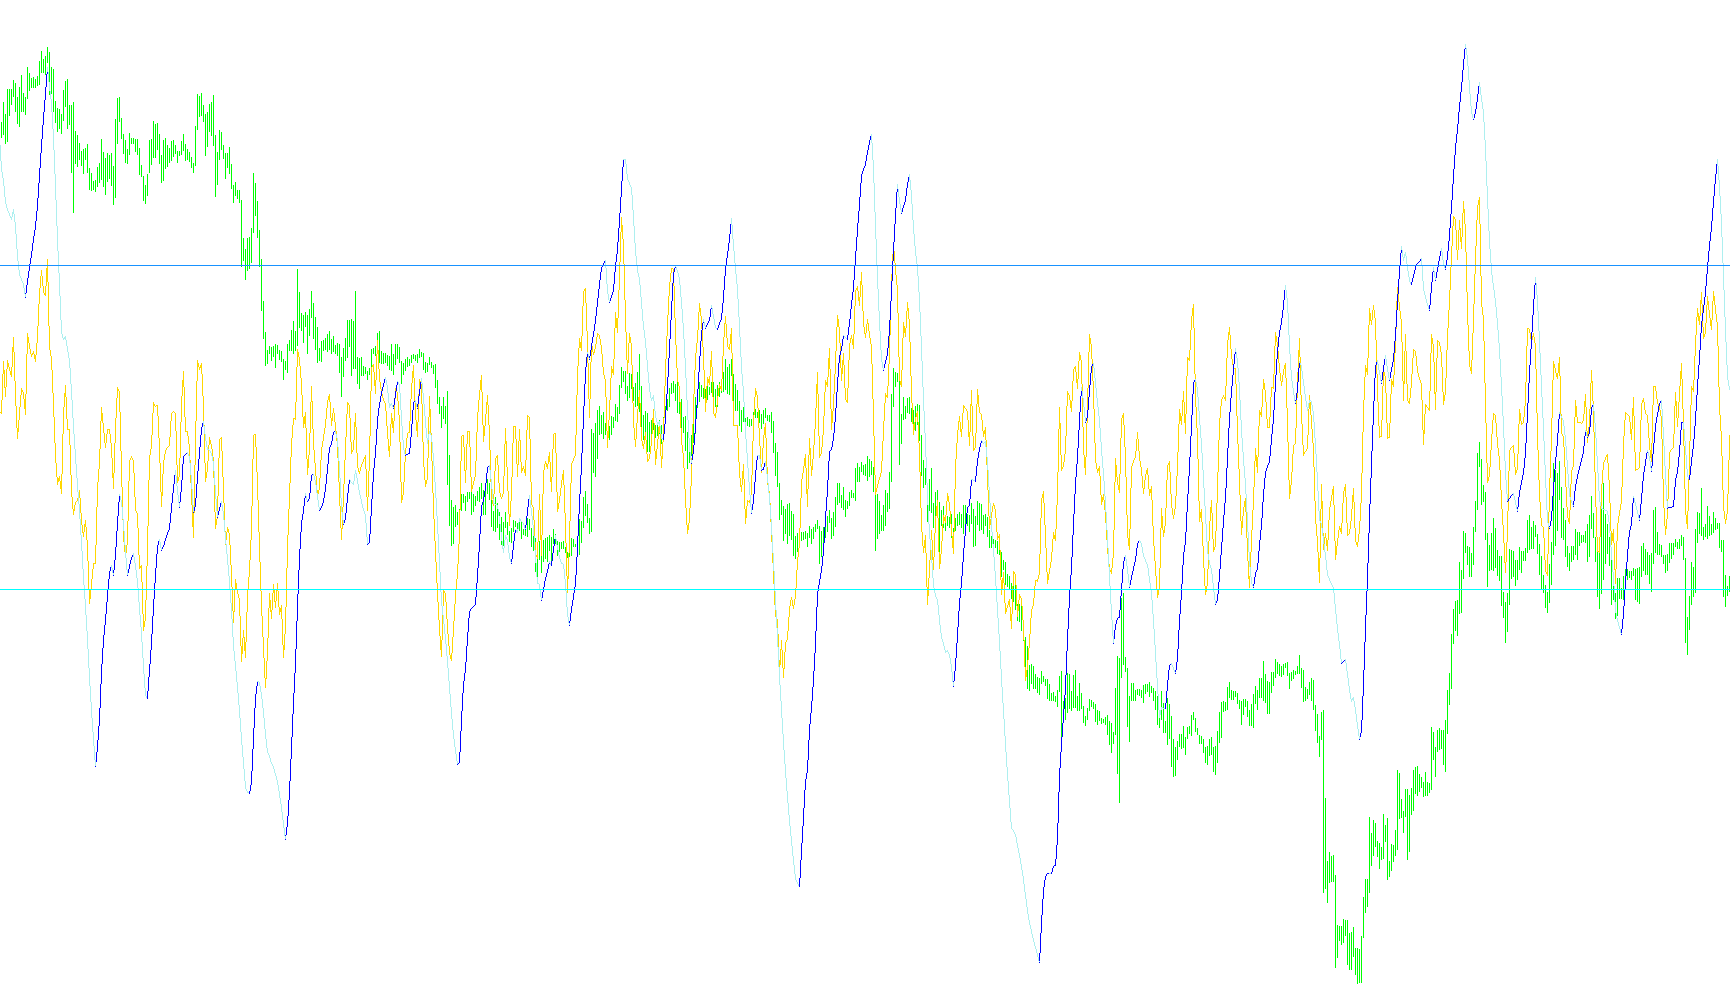
This script functions as a sophisticated technical analysis tool designed to help traders visualize market trends, strength, and momentum. Instead of looking at price alone, it analyzes the relationship between the high, low, and closing prices over a specific period to determine how aggressively the market is moving in a particular direction.
Core Logic and Functionality
1. Trend Strength Identification (ADX) The primary purpose of the tool is to calculate a trend strength indicator. It identifies whether the current market movement is trending strongly or if the price is simply drifting sideways in a range. It does this by measuring the "True Range" of price movements, comparing the distance between highs and lows against previous closing prices to ensure the data reflects real market volatility.
2. Directional Movement (DI) The script breaks down the movement into two components: upward pressure and downward pressure. By calculating the difference between current highs and previous lows (and vice versa), it determines which side is "winning." These values are smoothed over time to create a steady flow, allowing traders to see if bulls or bears have the upper hand at any given moment.
3. Momentum and Smoothing To prevent the data from being too erratic or "noisy," the script uses a smoothing constant (the "ki" factor). This ensures that the resulting lines on your chart represent consistent trends rather than momentary price spikes. It calculates the difference between the upward and downward forces to create a single, cohesive line representing the net directional power.
4. Peak Detection (ADXL) One of the more advanced features of this script is its ability to "mark" significant turning points. The logic monitors the trend strength and identifies specific peaks. When the strength reaches a high point and begins to reverse, the script flags that maximum value. This helps traders identify when a trend might be exhausting itself or reaching a climax.
5. Visual Reference Levels To make the data actionable for the human eye, the script automatically plots constant horizontal levels. These serve as "thresholds." By comparing the moving trend line against these levels, a trader can quickly determine if the current market momentum has crossed into a high-strength zone or remains in a weak, non-trending state.
Summary for the Trader
In simple terms, this tool tells you two things simultaneously:
- How strong is the current move? (The primary trend line)
- Is the move gaining or losing steam? (The peak detection and level crossovers)
It filters out the "noise" of constant price fluctuations to provide a clearer picture of whether it is a good time to follow a trend or if the market is becoming too exhausted to continue in its current direction.
//-------ANG3110@latchess.com-------
//****************************************
#property indicator_separate_window
#property indicator_buffers 5
#property indicator_color1 LightSlateGray
#property indicator_color2 DodgerBlue
#property indicator_color3 SandyBrown
#property indicator_color4 Lavender
#property indicator_color5 Lavender
#property indicator_width2 2
#property indicator_width3 2
#property indicator_style4 2
#property indicator_style5 2
#property indicator_level1 0
//=====================================
extern int p=14;
extern int Level=25;
//=====================================
double ADX[],ADXL[],DI[],levh[],levl[];
double dh,dl,tr,H,L,num1,num2,num3,dhk,dlk,div;
double zdh,zdhp,zdl,zdlp,zdx,zdxp,zdhl,si;
double temp,ki;
int fs,fss,ti;
//*********************************************************
int init()
{
   IndicatorShortName("ADXm "+"("+p+")");
   //--------------------
   SetIndexBuffer(0,DI);
   SetIndexBuffer(1,ADX);
   SetIndexBuffer(2,ADXL); SetIndexEmptyValue(2,0.0);
   SetIndexBuffer(3,levh);
   SetIndexBuffer(4,levl);
   //--------------------
   return(0);
}
//*********************************************************
int start()
{
   int cbi,IC=Bars-IndicatorCounted()-1;
   if (IC<10) cbi=IC; else
   {
      cbi=Bars-2;
      ki=2.0/(p+1);
      ADX[cbi+1]=0.0; ADXL[cbi+1]=0.0;
      zdhp=0.0; zdh=0.0; zdlp=0.0; zdl=0.0; zdxp=0.0; zdx=0.0;
      ti=Time[cbi]; fs=0; fss=0;
   }
   //-------------------------------------------------
   for (int i=cbi; i>=0; i--)
   {
      if (ti!=Time[i]) {zdhp=zdh; zdlp=zdl; zdxp=zdx; ti=Time[i];}

      H=High[i]; L=Low[i];

      dh=H-High[i+1];
      dl=Low[i+1]-L;

      if(dh<0) dh=0;
      if(dl<0) dl=0;

      if(dh==dl) {dh=0; dl=0;} else if(dh<dl) dh=0; else if(dl<dh) dl=0;

      num1=MathAbs(H-L);
      num2=MathAbs(H-Close[i+1]);
      num3=MathAbs(L-Close[i+1]);

      tr=MathMax(MathMax(num1,num2),num3);

      if(tr==0) {dhk=0; dlk=0;} else {dhk=100.0*dh/tr; dlk=100.0*dl/tr;}

      zdh=zdhp+(dhk-zdhp)*ki;
      zdl=zdlp+(dlk-zdlp)*ki;

      zdhl=zdh-zdl; DI[i]=zdhl;

      div=MathAbs(zdh+zdl);
      if(div==0.00) temp=0; else temp=100*(MathAbs(zdhl)/div);

      if (zdh>zdl) fs=1;
      if (zdh<zdl) fs=2;

      if (fs==2) temp=-temp;

      zdx=zdxp+(temp-zdxp)*ki;

      ADX[i]=zdx;

      if (ADX[i]>ADX[i+1]) fss=1;
      if (ADX[i]<ADX[i+1]) {if (fss==1) ADXL[i+1]=ADX[i+1]; fss=2;}
      if (fss==2) ADXL[i]=ADX[i]; else ADXL[i]=0.0;

      levh[i]=Level;
      levl[i]=-Level;
   }
   return(0);
}
//******************************************************************
Comments