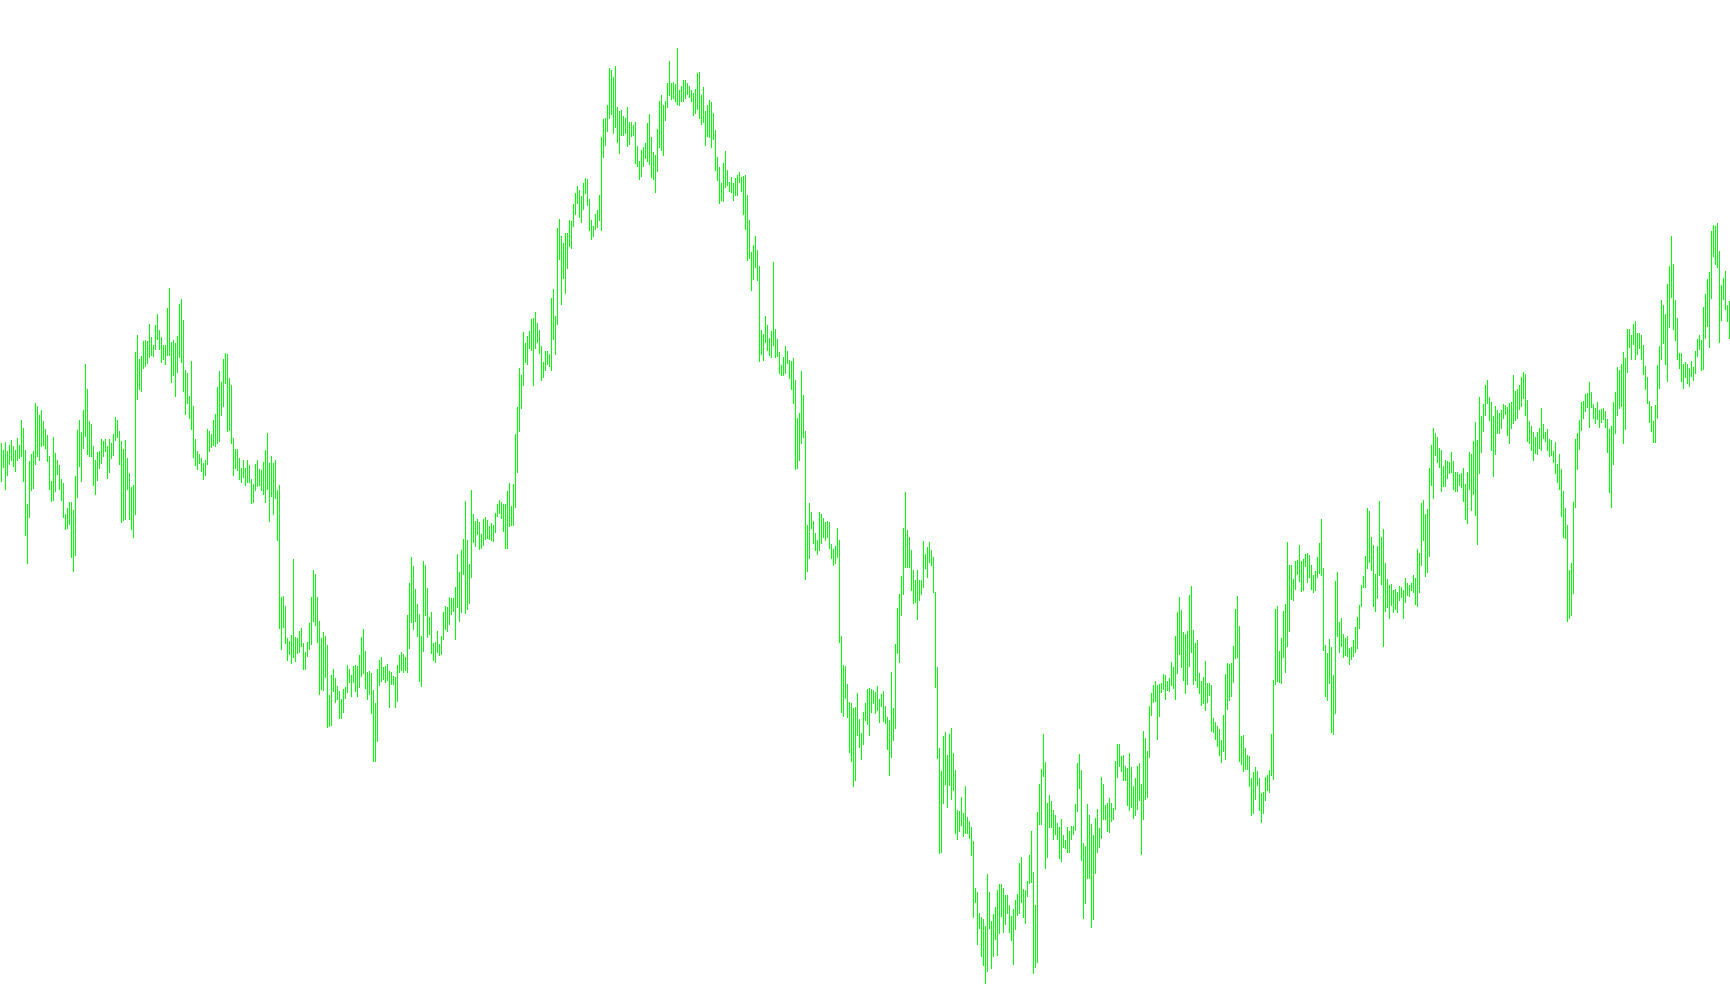
This script is designed to function as a visual trend-tracking tool, specifically identifying significant "peaks" and "valleys" in price movement. Rather than showing every small fluctuation in the market, it filters out minor price noise to highlight the most important structural turning points.
How the Logic Works
The tool operates through a multi-stage process to ensure that only meaningful price movements are displayed on your chart:
1. Identifying Local Extremes The script constantly scans a specific window of recent price bars (defined by the "Depth" setting) to find the highest highs and lowest lows. It looks for points where the price has reached a peak or a trough within that timeframe.
2. Filtering Out Minor Noise To prevent the chart from becoming cluttered with insignificant wiggles, the script applies two specific filters:
- Deviation Check: It measures the distance between the current price and the identified extreme point. If the movement is too small (less than the "Deviation" setting), it ignores it.
- Backstep Validation: The script looks back at the immediate previous points to ensure that a new peak or valley is truly significant relative to what happened just before it.
3. Peak and Valley Coordination The logic ensures that the tool recognizes the natural flow of price action. It identifies a "High" (peak) and a "Low" (valley) in sequence. If the script detects a new high that is more significant than a previous one, it intelligently updates the display to reflect the most prominent point of interest.
4. Visual Cleanup and Final Rendering In its final processing stage, the script performs a "cleanup" pass. It cross-references the identified highs and lows to ensure they are logically connected. This ensures that the final visual result is a clean, jagged line (often referred to as a ZigZag) that connects the most important structural points of the market, making it easier for traders to see the overall trend at a glance.
Summary for the User
Essentially, this script acts as an automated "filter" for your price chart. It ignores the minor daily chatter and only draws lines connecting the major highs and lows that meet your specific criteria for depth and significance.
//+------------------------------------------------------------------+
//|                                        Custom Moving Average.mq4 |
//|                      Copyright © 2005, MetaQuotes Software Corp. |
//|                                       http://www.metaquotes.net/ |
//+------------------------------------------------------------------+
#property copyright "Copyright © 2005, MetaQuotes Software Corp."
#property link      "http://www.metaquotes.net/"

#property indicator_chart_window
#property indicator_buffers 1
#property indicator_color1 Red
//---- indicator parameters
extern int ExtDepth=12;
extern int ExtDeviation=5;
extern int ExtBackstep=3;
//---- indicator buffers
double ExtMapBuffer[];
double ExtMapBuffer2[];

int timeFirstBar=0;

//+------------------------------------------------------------------+
//| Custom indicator initialization function                         |
//+------------------------------------------------------------------+
int init()
  {
   IndicatorBuffers(2);
//---- drawing settings
   SetIndexStyle(0,DRAW_SECTION);
//---- indicator buffers mapping
   SetIndexBuffer(0,ExtMapBuffer);
   SetIndexBuffer(1,ExtMapBuffer2);
   SetIndexEmptyValue(0,0.0);
   SetIndexEmptyValue(1,0.0);
//   ArraySetAsSeries(ExtMapBuffer,true);
//   ArraySetAsSeries(ExtMapBuffer2,true);
//---- indicator short name
   IndicatorShortName("ZigZag("+ExtDepth+","+ExtDeviation+","+ExtBackstep+")");
//---- initialization done
   return(0);
  }
//+------------------------------------------------------------------+
//|                                                                  |
//+------------------------------------------------------------------+
int start()
  {
   int    shift, back,lasthighpos,lastlowpos;
   double val,res;
   double curlow,curhigh,lasthigh,lastlow;

   if (timeFirstBar!=Time[Bars-1])
     {
      timeFirstBar=Time[Bars-IndicatorCounted()-1];
      for (shift=Bars-1; shift>0;shift--) {ExtMapBuffer[shift]=0.0; ExtMapBuffer2[shift]=0.0;}
     }

   for(shift=Bars-ExtDepth; shift>=0; shift--)
     {
      val=Low[Lowest(NULL,0,MODE_LOW,ExtDepth,shift)];
      if(val==lastlow) val=0.0;
      else
        {
         lastlow=val;
         if((Low[shift]-val)>(ExtDeviation*Point)) val=0.0;
         else
           {
            for(back=1; back<=ExtBackstep; back++)
              {
               res=ExtMapBuffer[shift+back];
               if((res!=0)&&(res>val)) ExtMapBuffer[shift+back]=0.0;
              }
           }
        }
      if (Low[shift]==val) ExtMapBuffer[shift]=val;
      //--- high
      val=High[Highest(NULL,0,MODE_HIGH,ExtDepth,shift)];
      if(val==lasthigh) val=0.0;
      else
        {
         lasthigh=val;
         if((val-High[shift])>(ExtDeviation*Point)) val=0.0;
         else
           {
            for(back=1; back<=ExtBackstep; back++)
              {
               res=ExtMapBuffer2[shift+back];
               if((res!=0)&&(res<val)) ExtMapBuffer2[shift+back]=0.0;
              }
           }
        }
      if (High[shift]==val) ExtMapBuffer2[shift]=val;
     }

   // final cutting
   lasthigh=-1; lasthighpos=-1;
   lastlow=-1;  lastlowpos=-1;

   for(shift=Bars-ExtDepth; shift>=0; shift--)
     {
      curlow=ExtMapBuffer[shift];
      curhigh=ExtMapBuffer2[shift];
      if((curlow==0)&&(curhigh==0)) continue;
      //---
      if(curhigh!=0)
        {
         if(lasthigh>0)
           {
            if(lasthigh<curhigh) ExtMapBuffer2[lasthighpos]=0;
            else ExtMapBuffer2[shift]=0;
           }
         //---
         if(lasthigh<curhigh || lasthigh<0)
           {
            lasthigh=curhigh;
            lasthighpos=shift;
           }
         lastlow=-1;
        }
      //----
      if(curlow!=0)
        {
         if(lastlow>0)
           {
            if(lastlow>curlow) ExtMapBuffer[lastlowpos]=0;
            else ExtMapBuffer[shift]=0;
           }
         //---
         if((curlow<lastlow)||(lastlow<0))
           {
            lastlow=curlow;
            lastlowpos=shift;
           }
         lasthigh=-1;
        }
     }

   for(shift=Bars-1; shift>=0; shift--)
     {
      if(shift>=Bars-ExtDepth) ExtMapBuffer[shift]=0.0;
      else
        {
         res=ExtMapBuffer2[shift];
         if(res!=0.0)
           {
            if (ExtMapBuffer[shift]!=0.0) ExtMapBuffer[shift]=0.0; else ExtMapBuffer[shift]=res;
           }
        }
     }
  }
Comments