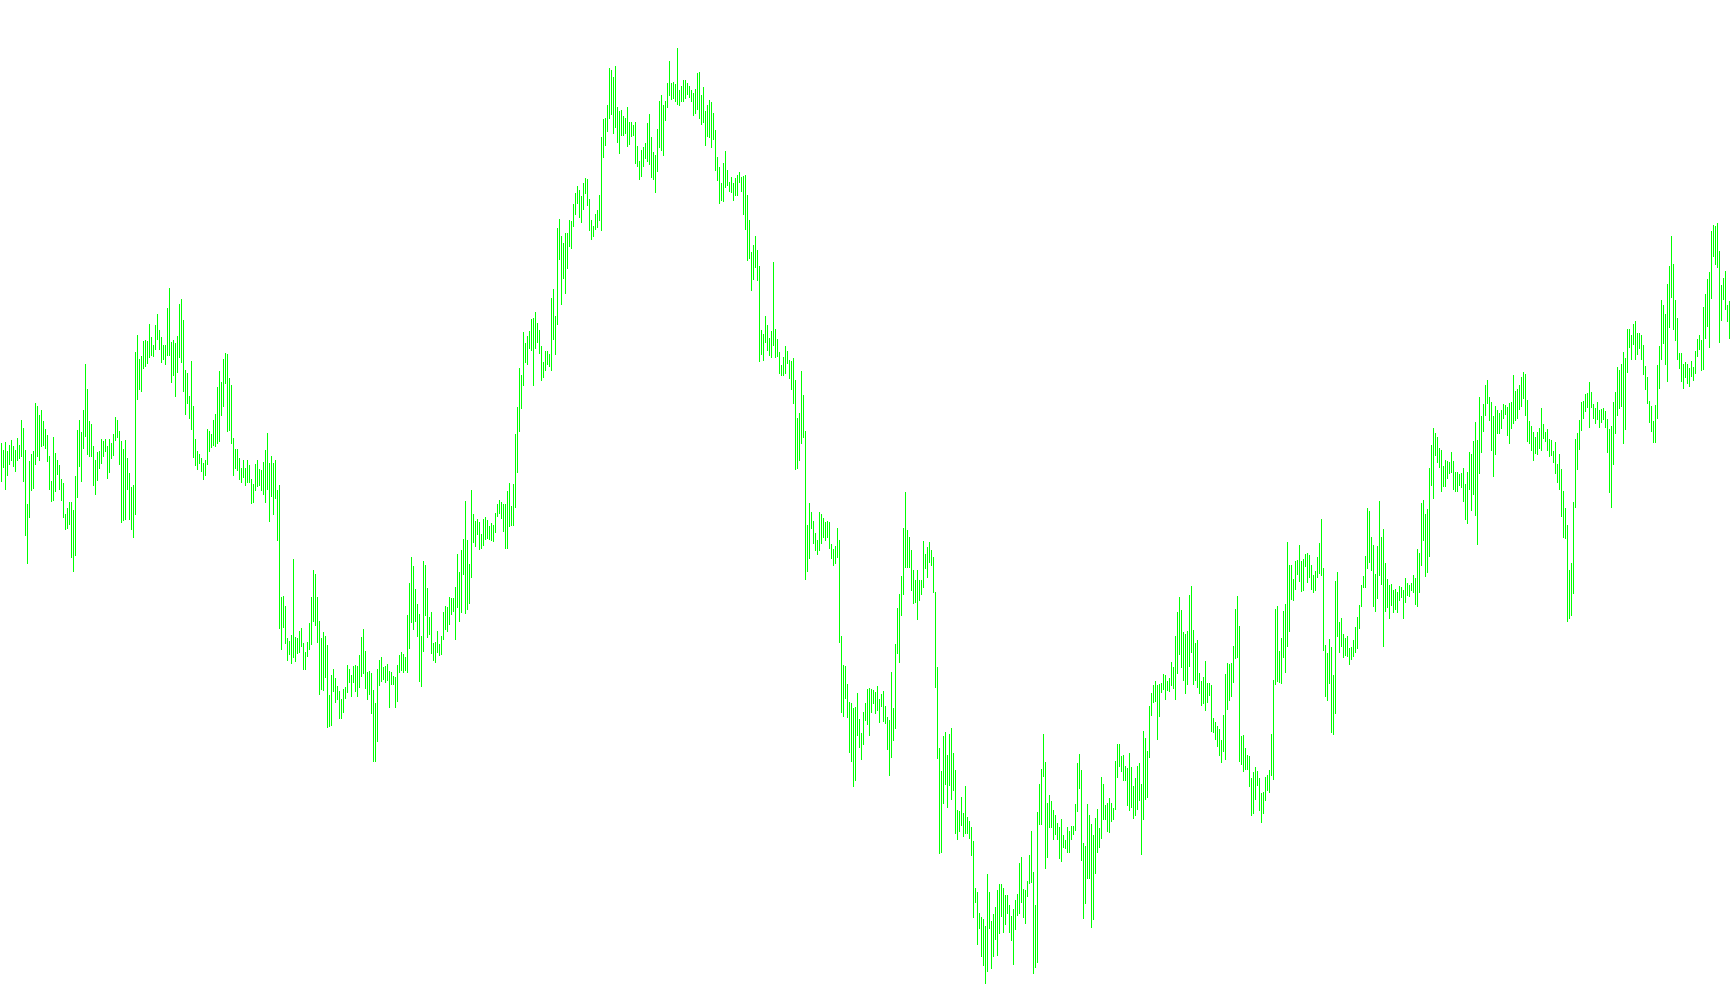
This script is designed to identify and visualize significant price movements on a trading chart by filtering out minor market noise. It focuses on capturing the primary "skeleton" of price action—the major highs and lows—to help traders see the underlying trend more clearly.
How the Logic Works
1. Identifying Major Turning Points The script first scans historical price data to locate significant peaks (highs) and valleys (lows). It doesn't react to every tiny fluctuation; instead, it uses three specific rules to decide what counts as a "major" point:
- Depth: It looks back over a set number of previous candles to find the highest or lowest price in that range.
- Deviation: It ensures that the price movement is significant enough to be considered a meaningful change, preventing the script from highlighting insignificant "jitters."
- Backstep: This acts as a refinement filter. If multiple points are found very close together, it simplifies them so that only the most prominent peak or valley remains.
2. Filtering and Cleaning Once the initial highs and lows are identified, the script performs a "cleaning" phase. It compares consecutive points to ensure they are logically sound. For example, if it finds a new high that is lower than the previous one in a specific sequence, it adjusts the data to ensure the path of the price movement remains continuous and logical. This prevents the visual lines from jumping back and forth erratically.
3. Visualizing Trend Channels After determining the major structural points of the market, the script draws two distinct trend lines (Upper and Lower bands) on your chart:
- Dynamic Updates: As new price data arrives, the script automatically identifies the most recent significant movements and moves these lines in real-time.
- Structural Support and Resistance: The Upper Band follows the primary high points of the market, while the Lower Band follows the primary low points.
Summary for the User
Essentially, this tool acts as a visual filter. It ignores the "noise" of constant small price movements and draws clear, solid lines connecting the most important structural highs and lows. This allows you to see the broader flow of the market—helping you identify where the current trend is heading and where significant boundaries (support and resistance) are forming.
//Version: 2
//Time: December 02, 2006
//+------------------------------------------------------------------+
//|                       ZigZag Channels                            |
//|                                              ZigZag_Channels.mq4 |
//|                                         Developed by Coders Guru |
//|                                            http://www.xpworx.com |
//+------------------------------------------------------------------+


#property indicator_chart_window
#property indicator_buffers 4
#property indicator_color1 Red


//---- indicator parameters
extern   int      ExtDepth       = 12;
extern   int      ExtDeviation   = 5;
extern   int      ExtBackstep    = 3;
extern   color    color_trend_1  = Yellow;
extern   color    color_trend_2  = Yellow;
extern   int      back           = 1;

//---- indicator buffers
double ExtMapBuffer[];
double ExtMapBuffer2[];
double upperband[];
double lowerband[];

datetime id = 0;
string upper;
string lower;

int deinit()
{
   ObjectDelete(lower);
   ObjectDelete(lower);
   return (0);
}

//+------------------------------------------------------------------+
//| Custom indicator initialization function                         |
//+------------------------------------------------------------------+
int init()
  {
   IndicatorBuffers(4);
//---- drawing settings
   SetIndexStyle(0,DRAW_SECTION);
//---- indicator buffers mapping
   SetIndexBuffer(0,ExtMapBuffer);
   SetIndexBuffer(1,ExtMapBuffer2);
   SetIndexBuffer(2,upperband);
   SetIndexBuffer(3,lowerband);

   SetIndexLabel(0,NULL) ;
   SetIndexLabel(1,NULL) ;
   SetIndexLabel(2,"Upper band") ;
   SetIndexLabel(3,"Lower band") ;

   SetIndexEmptyValue(0,0.0);
   ArraySetAsSeries(ExtMapBuffer,true);
   ArraySetAsSeries(ExtMapBuffer2,true);
   ArraySetAsSeries(upperband,true);
   ArraySetAsSeries(lowerband,true);

   //ObjectDelete(upper);
   //ObjectDelete(lower);
   id = Time[0]+TimeCurrent();
   upper = "trend_1_"+id;
   lower = "trend_2_"+id;

   return(0);
  }
//+------------------------------------------------------------------+
//|                                                                  |
//+------------------------------------------------------------------+
int start()
  {
   int    shift, back,lasthighpos,lastlowpos;
   double val,res;
   double curlow,curhigh,lasthigh,lastlow;

   for(shift=Bars-ExtDepth; shift>=0; shift--)
     {
      val=Low[Lowest(NULL,0,MODE_LOW,ExtDepth,shift)];
      if(val==lastlow) val=0.0;
      else
        {
         lastlow=val;
         if((Low[shift]-val)>(ExtDeviation*Point)) val=0.0;
         else
           {
            for(back=1; back<=ExtBackstep; back++)
              {
               res=ExtMapBuffer[shift+back];
               if((res!=0)&&(res>val)) ExtMapBuffer[shift+back]=0.0;
              }
           }
        }
      ExtMapBuffer[shift]=val;
      //--- high
      val=High[Highest(NULL,0,MODE_HIGH,ExtDepth,shift)];
      if(val==lasthigh) val=0.0;
      else
        {
         lasthigh=val;
         if((val-High[shift])>(ExtDeviation*Point)) val=0.0;
         else
           {
            for(back=1; back<=ExtBackstep; back++)
              {
               res=ExtMapBuffer2[shift+back];
               if((res!=0)&&(res<val)) ExtMapBuffer2[shift+back]=0.0;
              }
           }
        }
      ExtMapBuffer2[shift]=val;
     }

   // final cutting
   lasthigh=-1; lasthighpos=-1;
   lastlow=-1;  lastlowpos=-1;

   for(shift=Bars-ExtDepth; shift>=0; shift--)
     {
      curlow=ExtMapBuffer[shift];
      curhigh=ExtMapBuffer2[shift];
      if((curlow==0)&&(curhigh==0)) continue;
      //---
      if(curhigh!=0)
        {
         if(lasthigh>0)
           {
            if(lasthigh<curhigh) ExtMapBuffer2[lasthighpos]=0;
            else ExtMapBuffer2[shift]=0;
           }
         //---
         if(lasthigh<curhigh || lasthigh<0)
           {
            lasthigh=curhigh;
            lasthighpos=shift;
           }
         lastlow=-1;
        }
      //----
      if(curlow!=0)
        {
         if(lastlow>0)
           {
            if(lastlow>curlow) ExtMapBuffer[lastlowpos]=0;
            else ExtMapBuffer[shift]=0;
           }
         //---
         if((curlow<lastlow)||(lastlow<0))
           {
            lastlow=curlow;
            lastlowpos=shift;
           }
         lasthigh=-1;
        }
     }

   for(shift=Bars-1; shift>=0; shift--)
     {
      if(shift>=Bars-ExtDepth) ExtMapBuffer[shift]=0.0;
      else
        {
         res=ExtMapBuffer2[shift];
         if(res!=0.0) ExtMapBuffer[shift]=res;
        }
     }
     DrawTrends();

     for(shift=Bars-1; shift>=0; shift--)
     {
       upperband[shift]=    ObjectGetValueByShift(upper,shift);
       lowerband[shift]=    ObjectGetValueByShift(lower,shift);
     }
}


void DrawTrends()
{
   double temp = 0;
   int count = 0;
   double save_0 , save_1 , save_2 , save_3;
   int    t_0 , t_1 , t_2 , t_3;

   //get last up
   for(int i = 0 ; i < Bars ; i++)
   {
      temp = ExtMapBuffer[i];
      if (temp != 0) count++;
//      Print("count:", count);
      if(count == back + 1 && temp != 0) {save_0 = temp; t_0 = i;}
      if(count == back + 2 && temp != 0) {save_1 = temp; t_1 = i;}
      if(count == back + 3 && temp != 0) {save_2 = temp; t_2 = i;}
      if(count == back + 4 && temp != 0) {save_3 = temp; t_3 = i;}
      if(count == back + 5) break;
   }
   count = 0;
   //draw trends
//   Print(save_0,":",save_1,":",save_2,":",save_3);
   if((ObjectFind(lower)==-1) || (ObjectFind(lower)==-1))
   {
   ObjectCreate(lower,OBJ_TREND,0,iTime(NULL,0,t_3),save_3,iTime(NULL,0,t_1),save_1);
   ObjectCreate(upper,OBJ_TREND,0,iTime(NULL,0,t_2),save_2,iTime(NULL,0,t_0),save_0);
   ObjectSet(upper,OBJPROP_STYLE,STYLE_SOLID);
   ObjectSet(lower,OBJPROP_STYLE,STYLE_SOLID);
   ObjectSet(upper,OBJPROP_WIDTH,2);
   ObjectSet(lower,OBJPROP_WIDTH,2);
   ObjectSet(upper,OBJPROP_COLOR,color_trend_1);
   ObjectSet(lower,OBJPROP_COLOR,color_trend_2);
   }
   else
   {
   if (save_2!=0)
      {
      ObjectMove(upper, 0,iTime(NULL,0,t_2),save_2);
      ObjectMove(upper, 1,iTime(NULL,0,t_0),save_0);
      ObjectMove(lower, 0,iTime(NULL,0,t_3),save_3);
      ObjectMove(lower, 1,iTime(NULL,0,t_1),save_1);
      }
   }
}
Comments