Trendlines_force
Download script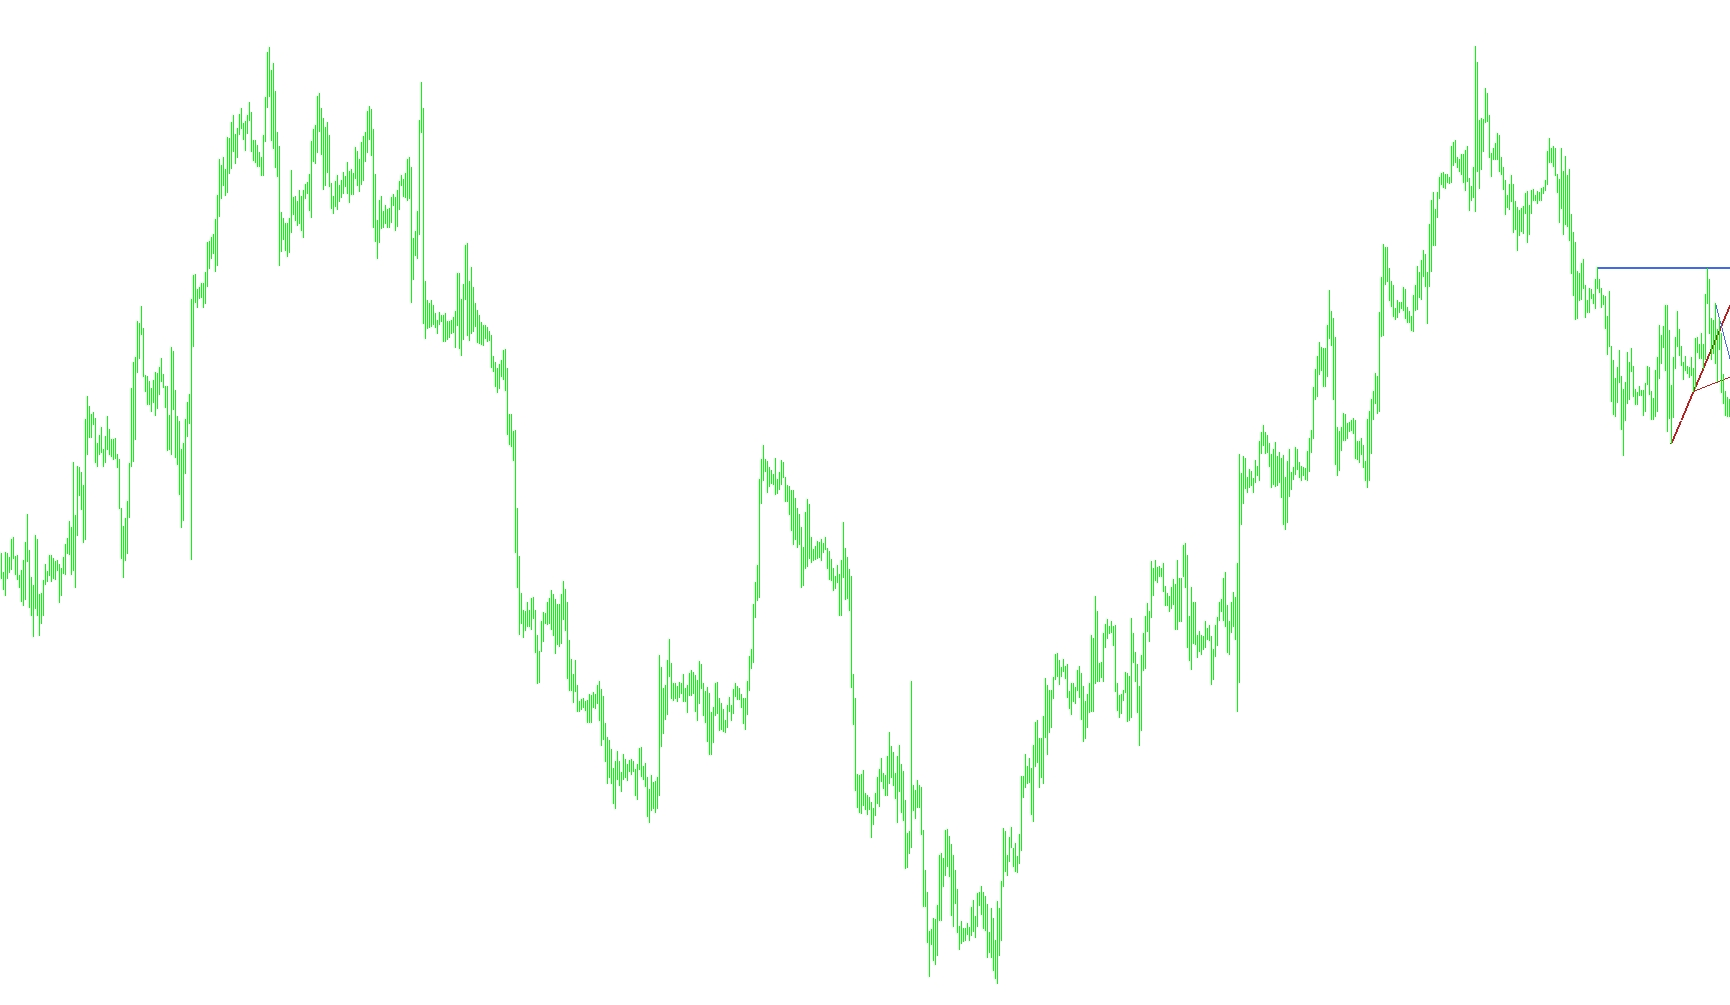
Overview of Indicator Logic
This script is designed to automatically identify and draw trendlines on a trading chart. Its primary purpose is to highlight key structural points in price action—specifically Resistance (high points where price struggles to break upward) and Support (low points where price struggles to fall further).
By analyzing multiple timeframes simultaneously, the tool helps traders visualize the "skeleton" of the market across different scales.
How the Logic Works
1. Multi-Timeframe Awareness
The script is designed to be "context-aware." Depending on which chart timeframe you are currently viewing (e.g., a 5-minute chart vs. a 1-hour chart), the indicator adjusts what it displays:
- On a 4-Hour Chart: It shows 4-hour trendlines.
- On a 1-Hour Chart: It shows both 4-hour and 1-hour trendlines.
- On a 15-Minute Chart: It shows 1-hour and 15-minute trendlines.
- On a 5-Minute Chart: It shows 1-hour, 15-minute, and 5-minute trendlines.
This "stacking" logic allows a trader to see how smaller price movements relate to the larger market trends.
2. Peak and Trough Detection
To draw a trendline, the script must first find two significant points of contact. It performs a scan of historical price data using specific mathematical checks:
- Higher Highs (Resistance): The script looks for "peaks." It identifies a point that is higher than both its immediate neighbors to confirm it is a local top. It then searches for the next relevant peak to connect the line.
- Lower Lows (Support): Similarly, the script looks for "troughs." It identifies points lower than their neighbors to confirm a local bottom and connects them to form the support line.
3. Dynamic Coordinate Mapping
One of the most sophisticated parts of the logic is how it handles different timeframes. Because a "peak" on a 1-hour chart happens at a specific time, but that time might appear differently on a 5-minute chart, the script includes a Position Correction mechanism.
If you are viewing a lower timeframe than the trendline's origin, the script calculates the exact historical coordinate to ensure the line is drawn accurately in the correct spot on your current screen.
4. Visual Customization
The logic automatically applies different visual styles based on the timeframe to keep the chart readable:
- Colors: Resistance lines are typically rendered in cooler tones (like Blue), while Support lines use warmer tones (like FireBrick).
- Line Styles: The script varies the thickness and "dash" style (Solid, Dashed, or Dash-Dot) depending on whether it is drawing a high-level trend (like 4H) or a low-level trend (like 5M). This helps the user instantly distinguish between long-term structure and short-term fluctuations.
Summary of Behavior
When you load this script, it constantly monitors new price bars. As soon as it detects a new significant high or low that meets its criteria, it dynamically draws or updates a trendline on your chart. It handles all the heavy lifting of calculating coordinates across different timeframes, providing the user with a clean, automated visual of market structure.
//+------------------------------------------------------------------+
//|                                                   Trendlines.mq4 |
//|                                      Copyright © 2006, John Hitt |
//|                                           jhitt@kanji.dyndns.org |
//+------------------------------------------------------------------+
#property copyright "Copyright © 2006, John Hitt"
#property link      "jhitt@kanji.dyndns.org"

#property indicator_chart_window

extern color H4_R=RoyalBlue;
extern color H4_S=FireBrick;
extern color H1_R=RoyalBlue;
extern color H1_S=FireBrick;
extern color M15_R=RoyalBlue;
extern color M15_S=FireBrick;
extern color M5_R=GreenYellow;
extern color M5_S=DeepPink;

#define RESISTANCE 1
#define SUPPORT 2

//+------------------------------------------------------------------+
//| Custom indicator initialization function                         |
//+------------------------------------------------------------------+
int init()
  {
//---- indicators

//----
   return(0);
  }
//+------------------------------------------------------------------+
//| Custom indicator deinitialization function                       |
//+------------------------------------------------------------------+
int deinit()
  {
//----
   ObjectDelete("H4_R");
   ObjectDelete("H4_S");
   ObjectDelete("H1_R");
   ObjectDelete("H1_S");
   ObjectDelete("M15_R");
   ObjectDelete("M15_S");
   ObjectDelete("M5_R");
   ObjectDelete("M5_S");
//----
   return(0);
  }
//+------------------------------------------------------------------+
//| Custom indicator iteration function                              |
//+------------------------------------------------------------------+
int start()
  {
   datetime currentbar = 0;

   if (currentbar != Time[0])
   {
      switch (Period())
      {
         case PERIOD_H4:
            Draw_H4_Trends();
            break;
         case PERIOD_H1:
            Draw_H4_Trends();
            Draw_H1_Trends();
            break;
         case PERIOD_M15:
            //Draw_H4_Trends();    //additional
            Draw_H1_Trends();
            Draw_M15_Trends();
            break;
         case PERIOD_M5:
            Draw_H1_Trends();    //additional
            Draw_M15_Trends();
            Draw_M5_Trends();    //additional
            break;
       }
   }

   return(0);
  }

void Draw_M5_Trends()
{
   int sbar=0;
   int ebar=0;
   int i;
   double rate_array[][6];

   ArrayCopyRates(rate_array, Symbol(), PERIOD_M5);

   for (i=2; i < Bars; i++)
   {
      if (HigherHigh(i, 1, rate_array) == true)
      {
        //Print("HiherHigh: ", i);
        if (ebar == 0)
          ebar = i;
        else if (sbar == 0 && rate_array[i][3] > rate_array[ebar][3]) // use 3 for high
          sbar = i;
      }
      if (sbar !=0 && ebar !=0)
         break;
   }
   DrawTrendline ("M5_R", ebar, sbar, PERIOD_M5, RESISTANCE, rate_array);

   ebar = 0;
   sbar = 0;

   for (i=2; i < Bars; i++)
   {
      if (LowerLow(i, 1, rate_array) == true)
      {
        if (ebar == 0)
          ebar = i;
        else if (sbar == 0 && rate_array[i][2] < rate_array[ebar][2]) // use 2 for low
          sbar = i;
      }
      if (sbar !=0 && ebar !=0)
         break;
   }
   DrawTrendline ("M5_S", ebar, sbar, PERIOD_M5, SUPPORT, rate_array);

}

void Draw_M15_Trends()
{
   int sbar=0;
   int ebar=0;
   int i;
   double rate_array[][6];

   ArrayCopyRates(rate_array, Symbol(), PERIOD_M15);

   for (i=2; i < Bars; i++)
   {
      if (HigherHigh(i, 1, rate_array) == true)
      {
        //Print("HiherHigh: ", i);
        if (ebar == 0)
          ebar = i;
        else if (sbar == 0 && rate_array[i][3] > rate_array[ebar][3]) // use 3 for high
          sbar = i;
      }
      if (sbar !=0 && ebar !=0)
         break;
   }
   DrawTrendline ("M15_R", ebar, sbar, PERIOD_M15, RESISTANCE, rate_array);

   ebar = 0;
   sbar = 0;

   for (i=2; i < Bars; i++)
   {
      if (LowerLow(i, 1, rate_array) == true)
      {
        if (ebar == 0)
          ebar = i;
        else if (sbar == 0 && rate_array[i][2] < rate_array[ebar][2]) // use 2 for low
          sbar = i;
      }
      if (sbar !=0 && ebar !=0)
         break;
   }
   DrawTrendline ("M15_S", ebar, sbar, PERIOD_M15, SUPPORT, rate_array);

}

void Draw_H1_Trends()
{
   int sbar=0;
   int ebar=0;
   int i;
   double rate_array[][6];

   ArrayCopyRates(rate_array, Symbol(), PERIOD_H1);

   for (i=2; i < Bars; i++)
   {
      if (HigherHigh(i, 1, rate_array) == true)
      {
        //Print("HiherHigh: ", i);
        if (ebar == 0)
          ebar = i;
        else if (sbar == 0 && rate_array[i][3] > rate_array[ebar][3]) // use 3 for high
          sbar = i;
      }
      if (sbar !=0 && ebar !=0)
         break;
   }
   DrawTrendline ("H1_R", ebar, sbar, PERIOD_H1, RESISTANCE, rate_array);

   ebar = 0;
   sbar = 0;

   for (i=2; i < Bars; i++)
   {
      if (LowerLow(i, 1, rate_array) == true)
      {
        if (ebar == 0)
          ebar = i;
        else if (sbar == 0 && rate_array[i][2] < rate_array[ebar][2]) // use 2 for low
          sbar = i;
      }
      if (sbar !=0 && ebar !=0)
         break;
   }
   DrawTrendline ("H1_S", ebar, sbar, PERIOD_H1, SUPPORT, rate_array);

}

void Draw_H4_Trends()
{
   int sbar=0;
   int ebar=0;
   int i;
   double rate_array[][6];

   ArrayCopyRates(rate_array, Symbol(), PERIOD_H4);

   for (i=2; i < Bars; i++)
   {
      if (HigherHigh(i, 1, rate_array) == true)
      {
        //Print("HiherHigh: ", i);
        if (ebar == 0)
          ebar = i;
        else if (sbar == 0 && rate_array[i][3] > rate_array[ebar][3]) // use 3 for high
          sbar = i;
      }
      if (sbar !=0 && ebar !=0)
         break;
   }
   DrawTrendline ("H4_R", ebar, sbar, PERIOD_H4, RESISTANCE, rate_array);

   ebar = 0;
   sbar = 0;

   for (i=2; i < Bars; i++)
   {
      if (LowerLow(i, 1, rate_array) == true)
      {
        if (ebar == 0)
          ebar = i;
        else if (sbar == 0 && rate_array[i][2] < rate_array[ebar][2]) // use 2 for low
          sbar = i;
      }
      if (sbar !=0 && ebar !=0)
         break;
   }
   DrawTrendline ("H4_S", ebar, sbar, PERIOD_H4, SUPPORT, rate_array);
}

 bool HigherHigh (int point, int shift, double array[][6])
  {
    if (shift == 0)
     return (true);

    if (array[point][3] >= array[point+shift][3] && array[point][3] >= array[point-shift][3])
    {
      if (array[point][3] == array[point+shift][3] || array[point][3] == array[point-shift][3])
      {
        if ((point - shift - 1) == 0)
          return (false);
        if (array[point][3] > array[point+shift+1][3] && array[point][3] > array[point-shift-1][3])
          return (HigherHigh (point, shift-1, array));
        else
          return (false);
      } else {
        return (HigherHigh (point, shift-1, array));
      }
    }
    else
      return (false);
  }

  bool LowerLow (int point, int shift, double array[][6])
  {
    if (shift == 0)
     return (true);

    if (array[point][2] <= array[point+shift][2] && array[point][2] <= array[point-shift][2])
    {
      if (array[point][2] == array[point+shift][2] || array[point][2] == array[point-shift][2])
      {
        if ((point-shift-1) == 0)
         return (false);
        if (array[point][2] < array[point+shift+1][2] && array[point][2] < array[point-shift-1][2])
          return(LowerLow (point, shift-1, array));
        else
          return (false);
      } else {
        return(LowerLow (point, shift-1, array));
      }
    }
    else
      return (false);
  }

 int GetRealPosition(int p1, double array[][6], int which, datetime value, double peak)
 {
   int i;

   for (i=0; i < Bars; i++)
   {
     if (array[i][0] == value || array[i][0] < value)
     {
        if (which == RESISTANCE)
        {
          if (array[i][3] == peak) return (i);
          if (array[i-1][3] == peak) return (i-1);
          if (array[i-2][3] == peak) return (i-2);
          if (array[i-3][3] == peak) return (i-3);
         } else {
          if (array[i][2] == peak) return (i);
          if (array[i-1][2] == peak) return (i-1);
          if (array[i-2][2] == peak) return (i-2);
          if (array[i-3][2] == peak) return (i-3);
         }
         if (array[i][0] < value) return (i);
     }
   }
   return (-1);
}

 int DrawTrendline (string name, int p1, int p2, int timeframe, int which, double r_array[][6])
 {
   color hue;
   int thickness = 1;
   int style = STYLE_DASH;
   double array[][6];

   ArrayCopyRates(array, Symbol(), Period());

   if (which == RESISTANCE)
   {
     hue = RoyalBlue;
     if (Period() != timeframe)
     {
       p1 = GetRealPosition(p1, array, which, r_array[p1][0], r_array[p1][3]);
       p2 = GetRealPosition(p2, array, which, r_array[p2][0], r_array[p2][3]);
     }
   }
   else
   {
     hue = FireBrick;
     if (Period() != timeframe)
     {
       p1 = GetRealPosition(p1, array, which, r_array[p1][0], r_array[p1][2]);
       p2 = GetRealPosition(p2, array, which, r_array[p2][0], r_array[p2][2]);
     }
   }

   switch(timeframe)
   {
      case PERIOD_H4:
         thickness = 2;
         style = STYLE_SOLID;
         if (which == RESISTANCE)
           hue = H4_R;
         else
           hue = H4_S;
         break;
      case PERIOD_H1:
         style = STYLE_SOLID;
         thickness = 1;
         if (which == RESISTANCE)
           hue = H1_R;
         else
           hue = H1_S;
         break;
      case PERIOD_M15:
         style = STYLE_DASHDOTDOT;
         thickness = 1;
         if (which == RESISTANCE)
           hue = M15_R;
         else
           hue = M15_S;
         break;
      case PERIOD_M5:
         style = STYLE_SOLID;
         thickness = 2;
         if (which == RESISTANCE)
           hue = M5_R;
         else
           hue = M5_S;
         break;
   }

   if (ObjectFind(name) < 0)
   {
     if (which == SUPPORT)
       ObjectCreate(name, OBJ_TREND, 0, array[p2][0], array[p2][2], array[p1][0], array[p1][2]);
     else
       ObjectCreate(name, OBJ_TREND, 0, array[p2][2], array[p2][3], array[p1][0], array[p1][3]);

     ObjectSet(name, OBJPROP_COLOR, hue);
     ObjectSet(name, OBJPROP_RAY, true);
     ObjectSet(name, OBJPROP_BACK, true);
     ObjectSet(name, OBJPROP_WIDTH, thickness);
     ObjectSet(name, OBJPROP_STYLE, style);
   }

   if (which == SUPPORT)
   { // Lows (0 == Time)
     ObjectMove (name, 0, array[p2][0], array[p2][2]);
     ObjectMove (name, 1, array[p1][0], array[p1][2]);
   }
   else
   { // Highs
     ObjectMove (name, 0, array[p2][0], array[p2][3]);
     ObjectMove (name, 1, array[p1][0], array[p1][3]);
   }

   ObjectsRedraw();
   return(0);
 }
Comments