ZigZag1
Download script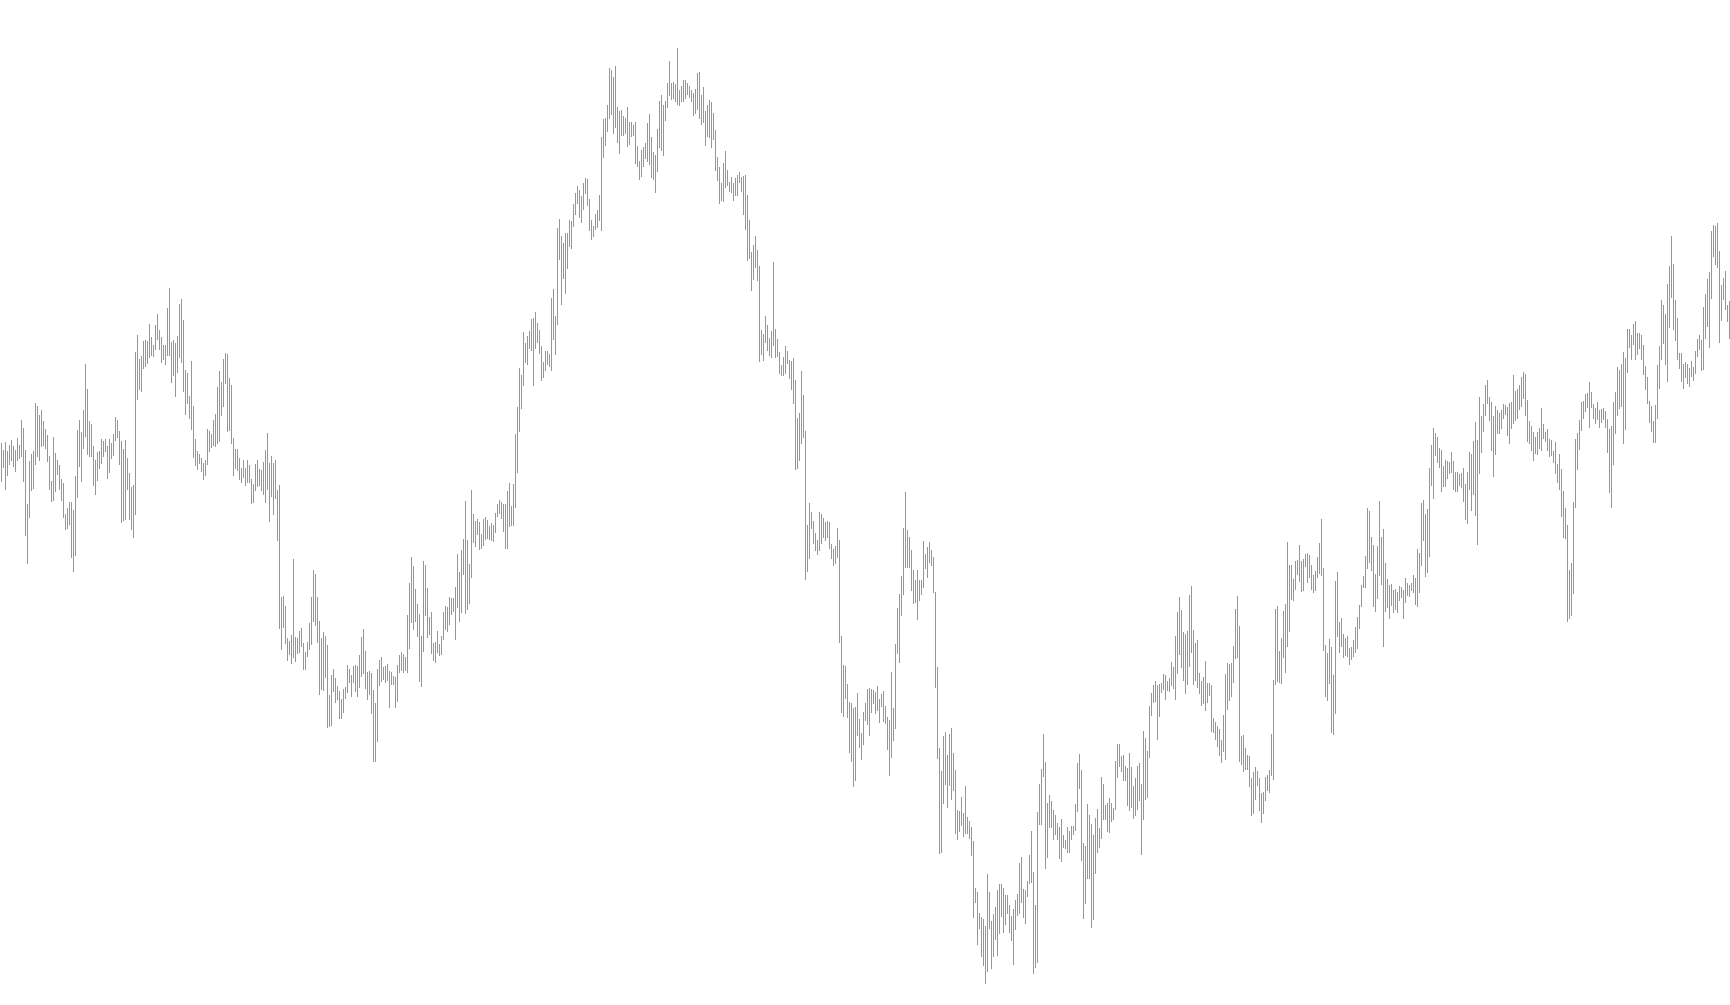
This script is designed to create a visual "ZigZag" indicator on a trading chart. Its primary purpose is to filter out the daily "noise" of minor price fluctuations and highlight the significant structural highs and lows of a market trend.
Core Logic Overview
The tool functions by scanning historical price data to identify meaningful turning points. It doesn't simply draw a line at every price change; instead, it follows a three-step logic process:
1. Identification of Extremes The script looks back over a specific number of candles (defined by the "Depth" setting) to find the highest and lowest prices reached in that period. It identifies these peaks and valleys as potential points of interest.
2. Sensitivity Filtering To ensure the chart isn't cluttered with every tiny movement, the script applies two main filters:
- Deviation: It checks if the price change is large enough to be considered significant. If a movement is too small, the script ignores it.
- Backstep: This ensures that the indicator doesn't create multiple points for the same trend move. It requires a minimum "distance" of candles between two major points, effectively smoothing out the path.
3. Peak and Valley Refinement Once the initial high and low points are identified, the script performs a "final cutting" process. This logic ensures that only the most extreme points are kept:
- If it finds a new peak that is higher than the previous one, it removes the old point and keeps the new one.
- Conversely, if it finds a new valley that is lower than the previous one, it adjusts the path accordingly.
- This creates a clean, alternating "zigzag" pattern where each peak is followed by a valley, and vice versa, clearly defining the market's structure.
Summary for the User
Essentially, this script acts as a "trend stabilizer." By ignoring minor price ticks and only highlighting major highs and lows, it allows you to see the underlying direction of the market more clearly, making it easier to identify support levels, resistance areas, and overall trend shifts.
//+------------------------------------------------------------------+
//|                                        Custom Moving Average.mq4 |
//|                      Copyright © 2005, MetaQuotes Software Corp. |
//|                                       http://www.metaquotes.net/ |
//+------------------------------------------------------------------+
#property copyright "Copyright © 2005, MetaQuotes Software Corp."
#property link      "http://www.metaquotes.net/"

#property indicator_chart_window
#property indicator_buffers 1
#property indicator_color1 Red
//---- indicator parameters
extern int ExtDepth=12;
extern int ExtDeviation=5;
extern int ExtBackstep=3;
//---- indicator buffers
double ExtMapBuffer[];
double ExtMapBuffer2[];

//+------------------------------------------------------------------+
//| Custom indicator initialization function                         |
//+------------------------------------------------------------------+
int init()
  {
   IndicatorBuffers(2);
//---- drawing settings
   SetIndexStyle(0,DRAW_SECTION);
//---- indicator buffers mapping
   SetIndexBuffer(0,ExtMapBuffer);
   SetIndexBuffer(1,ExtMapBuffer2);
   SetIndexEmptyValue(0,0.0);
   ArraySetAsSeries(ExtMapBuffer,true);
   ArraySetAsSeries(ExtMapBuffer2,true);
//---- indicator short name
   IndicatorShortName("ZigZag("+ExtDepth+","+ExtDeviation+","+ExtBackstep+")");
//---- initialization done
   return(0);
  }
//+------------------------------------------------------------------+
//|                                                                  |
//+------------------------------------------------------------------+
int start()
  {
   int    shift, back,lasthighpos,lastlowpos;
   double val,res;
   double curlow,curhigh,lasthigh,lastlow;

   for(shift=Bars-ExtDepth; shift>=0; shift--)
     {
      val=Low[Lowest(NULL,0,MODE_LOW,ExtDepth,shift)];
      if(val==lastlow) val=0.0;
      else
        {
         lastlow=val;
         if((Low[shift]-val)>(ExtDeviation*Point)) val=0.0;
         else
           {
            for(back=1; back<=ExtBackstep; back++)
              {
               res=ExtMapBuffer[shift+back];
               if((res!=0)&&(res>val)) ExtMapBuffer[shift+back]=0.0;
              }
           }
        }
      ExtMapBuffer[shift]=val;
      //--- high
      val=High[Highest(NULL,0,MODE_HIGH,ExtDepth,shift)];
      if(val==lasthigh) val=0.0;
      else
        {
         lasthigh=val;
         if((val-High[shift])>(ExtDeviation*Point)) val=0.0;
         else
           {
            for(back=1; back<=ExtBackstep; back++)
              {
               res=ExtMapBuffer2[shift+back];
               if((res!=0)&&(res<val)) ExtMapBuffer2[shift+back]=0.0;
              }
           }
        }
      ExtMapBuffer2[shift]=val;
     }

   // final cutting
   lasthigh=-1; lasthighpos=-1;
   lastlow=-1;  lastlowpos=-1;

   for(shift=Bars-ExtDepth; shift>=0; shift--)
     {
      curlow=ExtMapBuffer[shift];
      curhigh=ExtMapBuffer2[shift];
//      if((curlow==0.0)||(curhigh==0.0)) continue;
      //---
      if(curhigh!=0)
        {
         if(lasthigh>0)
           {
            if(lasthigh<curhigh) ExtMapBuffer2[lasthighpos]=0;
            else ExtMapBuffer2[shift]=0;
           }//ÿ
         //---
         if(lasthigh<curhigh || lasthigh<0)
           {
            lasthigh=curhigh;
            lasthighpos=shift;
           }// ÿ
         lastlow=-1;
        }//ÿ
      //----
      if(curlow!=0)
        {
         if(lastlow>0)
           {
            if(lastlow>curlow) ExtMapBuffer[lastlowpos]=0;
            else ExtMapBuffer[shift]=0;
           }//z
         //---
         if((curlow<lastlow)||(lastlow<0))
           {
            lastlow=curlow;
            lastlowpos=shift;
           }//z
         lasthigh=-1;
        }//
     }

   for(shift=Bars-1; shift>=0; shift--)
     {
      if(shift>=Bars-ExtDepth) ExtMapBuffer[shift]=0.0;
      else
        {
         res=ExtMapBuffer2[shift];
         if(res!=0.0) ExtMapBuffer[shift]=res;
         //if(res>0.0) ExtMapBuffer[shift]=res;
        }
     }
  }
Comments