CCI_CustomCandles
Download script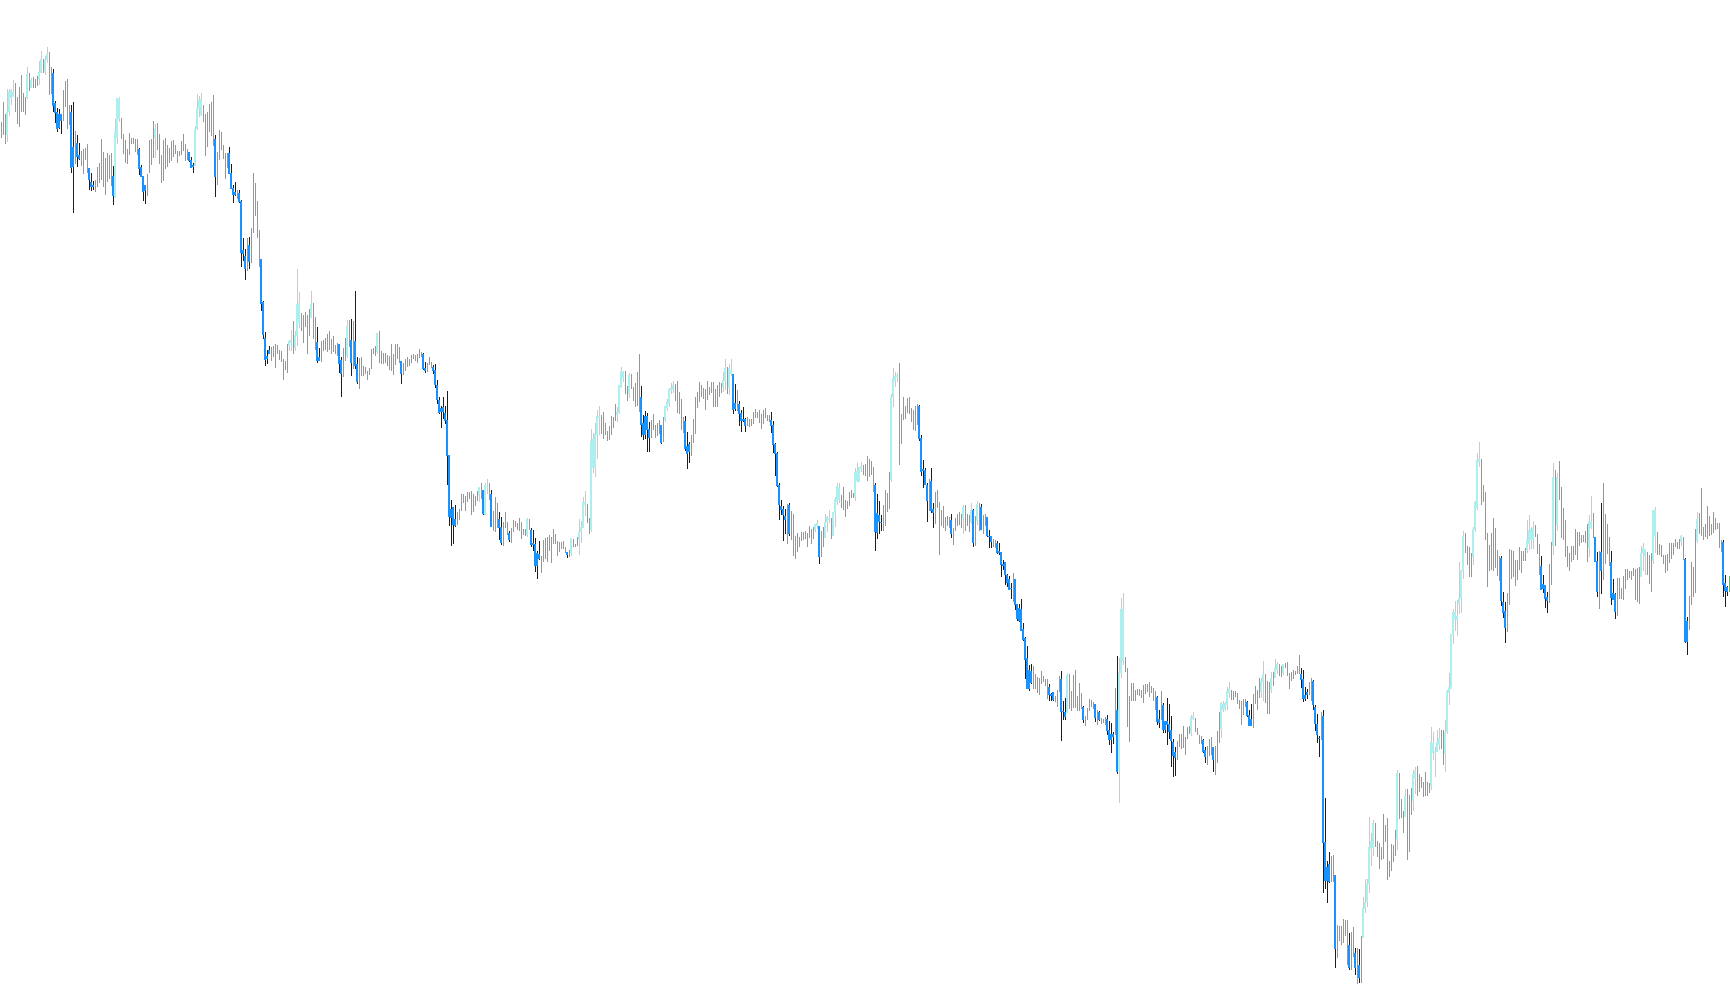
This script is designed to provide a visual overlay on your trading chart that highlights specific market conditions based on price momentum. Rather than just showing standard price bars, it uses the Commodity Channel Index (CCI)—a technical tool that measures how far the current price is moving away from its average—to determine the "mood" of the market.
How the Logic Works
The script constantly scans the recent price history and performs the following steps:
1. Momentum Analysis The core of the logic relies on a set threshold for the CCI indicator. It looks for two specific extremes:
- Overbought Territory: When the momentum suggests that prices have moved up significantly faster than usual.
- Oversold Territory: When the momentum suggests that prices have dropped significantly faster than usual.
2. Dynamic Visual Identification Instead of simply drawing a line or a separate window, the script modifies how information is presented on your candles:
- Condition Check: For every candle on your chart, the script calculates the current CCI value.
- Color Switching:
- If the market momentum exceeds the "Overbought" level, the script triggers a specific visual style (highlighted in Green).
- If the market momentum falls below the "Oversold" level, the script triggers a different visual style (highlighted in Red).
- Visual Weight: The logic distinguishes between the "body" of the candle (the main price movement) and the "wick" (the highest and lowest price reached during that period), ensuring that the visual highlights accurately reflect the intensity of the price action.
Summary for the User
In simple terms, this tool acts as an automated visual filter. It monitors the speed and strength of price movements in the background and automatically "paints" your chart to alert you when the market enters extreme zones. It allows you to quickly identify periods of high momentum at a glance, helping you see where the market might be overextended without having to manually interpret complex secondary graphs.
//+------------------------------------------------------------------+
//|                                            CCI CustomCandles.mq4 |
//|                                                  modified by cja |
//+------------------------------------------------------------------+
#property copyright "Copyright © 2007, Christof Risch (iya)"
#property link      "http://www.forexfactory.com/showthread.php?t=13321"
#property indicator_chart_window
//----
#property indicator_buffers 4
#property indicator_color1 Green //wick
#property indicator_color2 Red   //wick
#property indicator_color3 Green //candle
#property indicator_color4 Red   //candle
#property indicator_width1 1
#property indicator_width2 1
#property indicator_width3 3
#property indicator_width4 3
//---- stoch settings
extern int   CCI_Period     =14;
extern int   CCI_Price      =0;
extern int   Overbought     =100;
extern int   Oversold       =-100;
//---- input parameters
extern int   BarWidth        =1,
             CandleWidth     =3;
//---- buffers
double Bar1[],
       Bar2[],
       Candle1[],
       Candle2[];
//+------------------------------------------------------------------+
//| Custom indicator initialization function                         |
//+------------------------------------------------------------------+
int init()
  {
//---- indicators
   IndicatorShortName("CCI Candles:("+   CCI_Period+")");
   IndicatorBuffers(4);
   SetIndexBuffer(0,Bar1);
   SetIndexBuffer(1,Bar2);
   SetIndexBuffer(2,Candle1);
   SetIndexBuffer(3,Candle2);
   SetIndexStyle(0,DRAW_HISTOGRAM,0,BarWidth);
   SetIndexStyle(1,DRAW_HISTOGRAM,0,BarWidth);
   SetIndexStyle(2,DRAW_HISTOGRAM,0,CandleWidth);
   SetIndexStyle(3,DRAW_HISTOGRAM,0,CandleWidth);
//----
   return(0);
  }
//+------------------------------------------------------------------+
double CCI     (int i=0)   {return(iCCI(NULL,0,CCI_Period,CCI_Price,i));}
//+------------------------------------------------------------------+
void SetCandleColor(int col, int i)
  {
   double high,low,bodyHigh,bodyLow;
     {
      bodyHigh=MathMax(Open[i],Close[i]);
      bodyLow =MathMin(Open[i],Close[i]);
      high     =High[i];
      low     =Low[i];
     }
   Bar1[i]=low;   Candle1[i]=bodyLow;
   Bar2[i]=low;   Candle2[i]=bodyLow;
   switch(col)
     {
      case 1:    Bar1[i]=high;   Candle1[i]=bodyHigh;   break;
      case 2:    Bar2[i]=high;   Candle2[i]=bodyHigh;   break;
     }
  }
//+------------------------------------------------------------------+
//| Custom indicator iteration function                              |
//+------------------------------------------------------------------+
int start()
  {
   for(int i=MathMax(Bars-1-IndicatorCounted(),1); i>=0; i--)
     {
      double   cci  =CCI(i);
      if(cci > Overbought)      SetCandleColor(1,i);
      else   if(cci < Oversold)      SetCandleColor(2,i);
     }
//----
   return(0);
  }
//+------------------------------------------------------------------+
Comments