DivergenceWiseman 1
Download script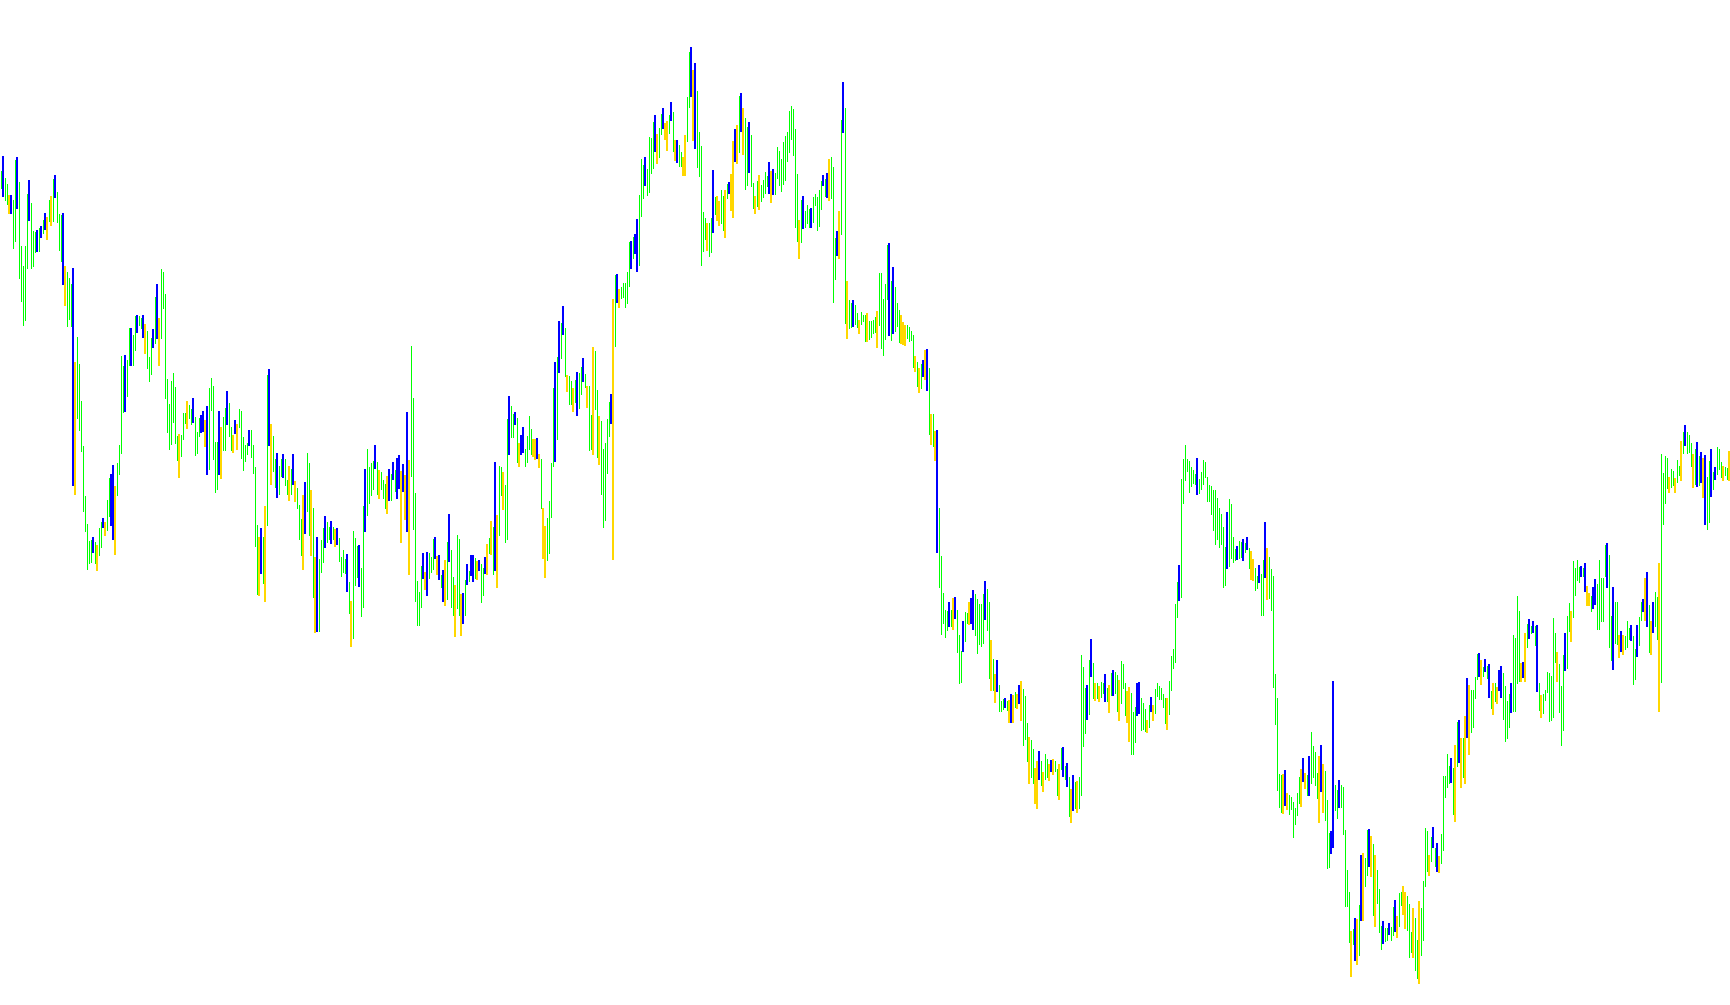
This indicator is designed to identify specific "divergent" price behaviors on a trading chart, specifically based on the concepts popularized by Bill Williams. Its primary goal is to highlight moments where the price action shows internal contradictions—situations where the high or low of a candle moves in one direction, but the actual closing price suggests a different momentum.
How the Logic Works
The script analyzes every individual candle on your chart by comparing its current movement against the previous candle. It looks for two specific types of discrepancies:
1. Bullish Divergence (Upward Pressure) The script checks if the current candle’s low price has dropped lower than the previous candle's low. If this happens, but the candle manages to close above its own "median" point (the halfway mark between its high and low), it signals a potential shift in strength. It suggests that while the price dipped, the "bulls" were strong enough to push the closing price back up toward the top half of the range.
2. Bearish Divergence (Downward Pressure) Conversely, the script looks for instances where the current candle’s high is higher than the previous candle's high. If the price reaches this new height but ends up closing below its own median point, it signals a potential shift in weakness. This indicates that despite a move upward, the "bears" successfully pushed the price back down into the bottom half of the range.
Visual Representation
When these specific conditions are met, the indicator draws a visual histogram on your chart:
- Bullish Signals: When a bullish divergence is detected, the script plots data points (shown in Aqua) to highlight the boundary of that movement.
- Bearish Signals: When a bearish divergence is detected, it plots data points (shown in Red) to mark those specific areas of weakness.
In essence, rather than just telling you which way the price is going, this tool identifies "exhaustion" or "rejection" points where the price tried to move in one direction but failed to maintain that momentum, potentially signaling a coming change in the trend.
//+------------------------------------------------------------------+
//|                                                    Wiseman 1.mq4 |
//|                           Bill Williams Wiseman 1 Divergent bars |
//|                                             Author: David Thomas |
//|                                      MQ4 Conversion: Pavel Kulko |
//|                                                  polk@alba.dp.ua |
//+------------------------------------------------------------------+
#property copyright "Copyright © 2005, Pavel Kulko"
#property link      "polk@alba.dp.ua"

#property indicator_chart_window
#property indicator_buffers 2
#property indicator_color1 Aqua
#property indicator_color2 Red

double UpBuf[],DnBuf[];
//+------------------------------------------------------------------+
//| Custom indicator initialization function                         |
//+------------------------------------------------------------------+
int init() {
   SetIndexStyle(0,DRAW_HISTOGRAM,0,2);
   SetIndexBuffer(0,UpBuf);
   SetIndexStyle(1,DRAW_HISTOGRAM,0,2);
   SetIndexBuffer(1,DnBuf);
   return(0);
}
//+------------------------------------------------------------------+
//| Custom indicator iteration function                              |
//+------------------------------------------------------------------+
int start() {
   int result;
   double median;
   int    counted_bars=IndicatorCounted();
   int limit = Bars-counted_bars-1;
   for(int i=limit; i>=0; i--) {
     result = 0;
     median = (High[i]+Low[i])/2;
     if((Low[i] < Low[i+1]) && (Close[i] > median)) result = -1;
     if((High[i] > High[i+1]) && (Close[i] < median)) result = 1;
     if(result > 0) {
       UpBuf[i] = Low[i];
       DnBuf[i] = High[i];
     }
     if(result < 0) {
       UpBuf[i] = High[i];
       DnBuf[i] = Low[i];
     }
   }
   return(0);
}
//+------------------------------------------------------------------+
Comments