NormalizedVolume_v2
Download script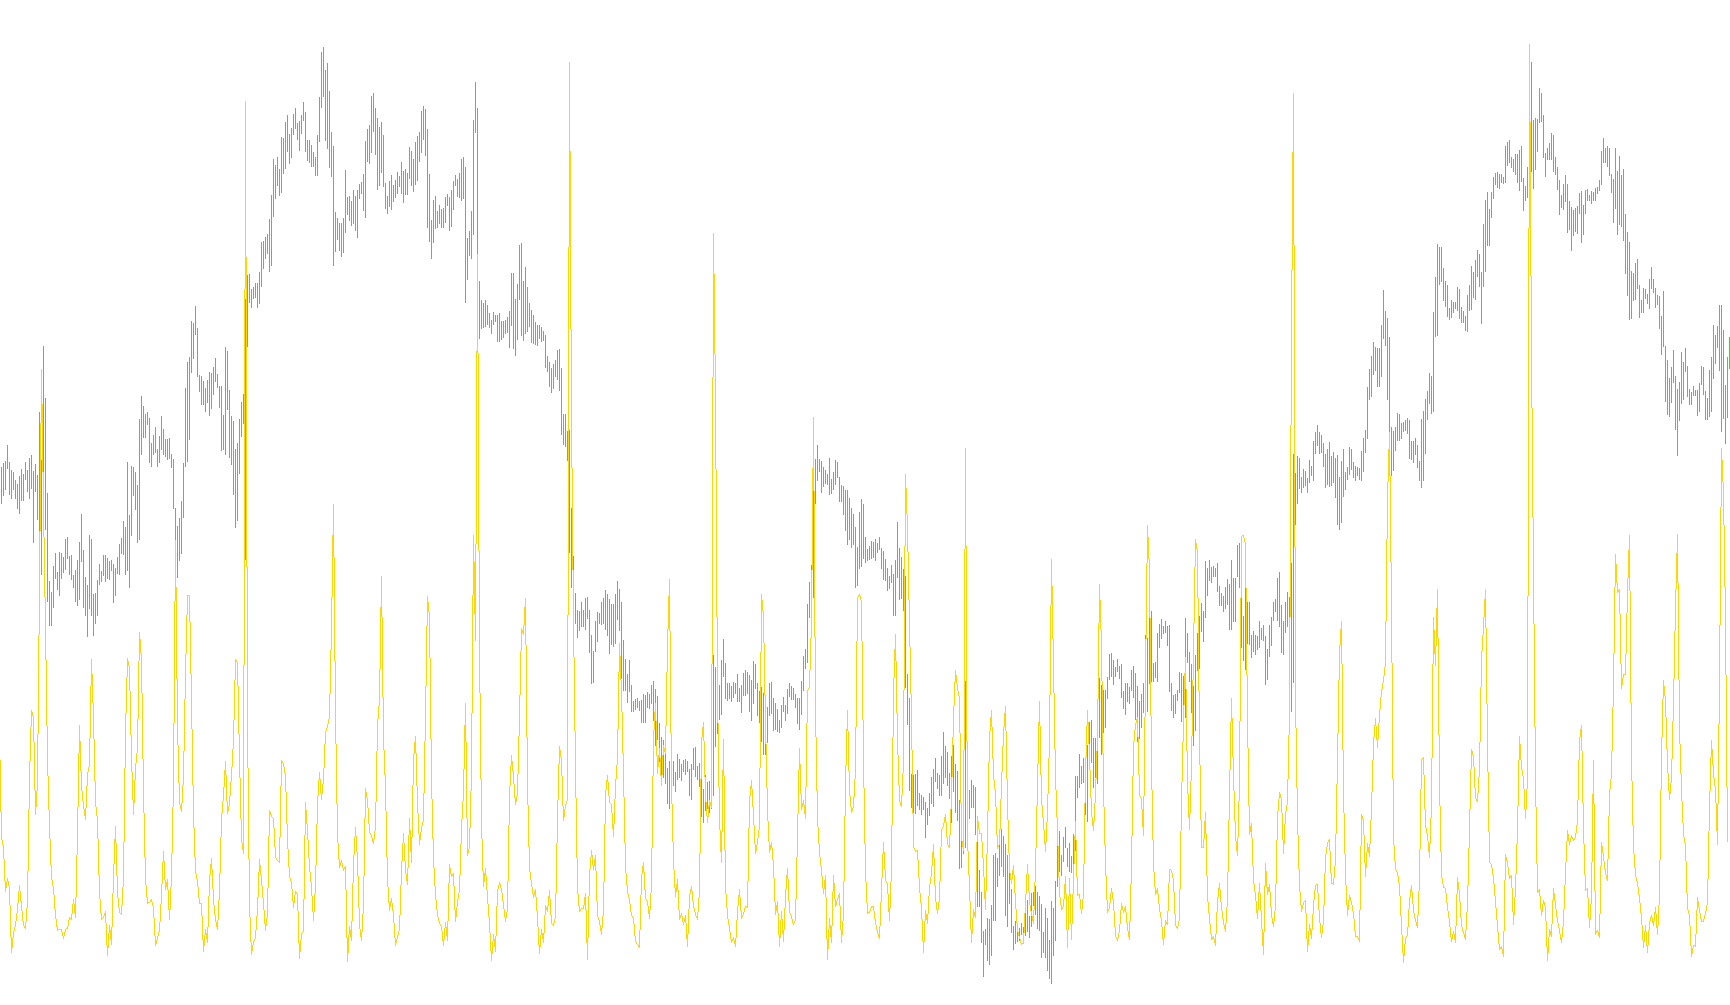
This tool is designed to provide traders with a clearer perspective on market activity by transforming raw trading volume into a "normalized" format. Instead of looking at the total number of units traded—which can fluctuate wildly in size and magnitude—this indicator scales that data to make it more readable and comparable over time.
How It Works
The core logic operates by comparing the current trading volume against its own historical average. By dividing the actual volume by a calculated moving average, the script strips away the "noise" of high-magnitude spikes and focuses on the relative strength of the current volume.
When the resulting value is above 1.0, it indicates that trading activity is currently higher than the established average. Conversely, when it falls below 1.0, it suggests that activity is lower than usual. This allows traders to identify periods of unusual intensity or significant cooling off more easily than they could by looking at raw volume bars alone.
Key Features and Customization
To ensure the tool fits different trading styles, it offers several layers of flexibility:
- Smoothing Methods: Users can choose between five different types of moving averages (such as Simple, Exponential, or Linear Weighted). This determines how "smooth" or "reactive" the baseline average will be. A smoother average helps identify long-term trends, while a more reactive one highlights immediate shifts in momentum.
- Adjustable Period: The timeframe over which the average is calculated can be customized. For example, you can set the tool to look at the average volume of the last 21 periods to determine what constitutes "normal" activity.
- Visual Clarity: The indicator is plotted as a distinct line in a separate window, making it easy to observe at a glance whether the current market pressure is expanding or contracting relative to recent history.
In essence, this script acts as a filter that helps traders distinguish between standard market participation and significant outliers, providing a more balanced view of supply and demand dynamics.
//+------------------------------------------------------------------+
//|                                          NormalizedVolume_v2.mq4 |
//|                         Copyright © Vadim Shumilov (DrShumiloff) |
//|                                                shumiloff@mail.ru |
//|                                                     ICQ 84796634 |
//+------------------------------------------------------------------+
#property copyright "Vadim Shumilov (DrShumiloff)"
#property link      "shumiloff@mail.ru"
//----
#property indicator_separate_window
#property indicator_buffers 1
#property indicator_color1 LightSeaGreen
#property indicator_width1 2
#property indicator_level1 1.0
#property indicator_level2 2.0
#property indicator_minimum 0

/*
Method:
0 - MODE_SMA
1 - MODE_EMA
2 - MODE_SMMA
3 - MODE_LWMA
4 - MODE_LRMA
*/
extern int Method = 0;
extern int VolumePeriod = 21;
extern int Shift = 1;

double Buffer[];
double ExtBuffer[];

int init()
{
   IndicatorBuffers(1);
   SetIndexStyle(0, DRAW_LINE);
   SetIndexBuffer(0, ExtBuffer);
   SetIndexDrawBegin(0, VolumePeriod);

   string short_name = "NV (" + VolumePeriod + ")";
   IndicatorShortName(short_name);
   SetIndexLabel(0, short_name);

   ArrayResize(Buffer, Bars);      ArrayInitialize(Buffer, 0);
   ArrayResize(ExtBuffer, Bars);   ArrayInitialize(ExtBuffer, 0);

   return(0);
}

int start()
{
   int i, limit;
   int counted_bars = IndicatorCounted();
   if (counted_bars > 0) counted_bars--;
   limit = Bars - counted_bars;

   ArraySetAsSeries(Buffer, true);
   for(i = 0; i < limit; i++) Buffer[i] = Volume[i];

   for(i = 0; i < limit; i++)
   {
      if (Method < 4)
        ExtBuffer[i] = NormalizeDouble(Buffer[i] / iMAOnArray(Buffer, 0, VolumePeriod, 0, Method, i+Shift), 4);
      else
        ExtBuffer[i] = NormalizeDouble(Buffer[i] / (3*iMAOnArray(Buffer, 0, VolumePeriod, 0, MODE_LWMA, i+Shift) - 2*iMAOnArray(Buffer, 0, VolumePeriod, 0, MODE_SMA, i+Shift)), 4);
   }
   return(0);
}
Comments