Trendlinesday_v3
Download script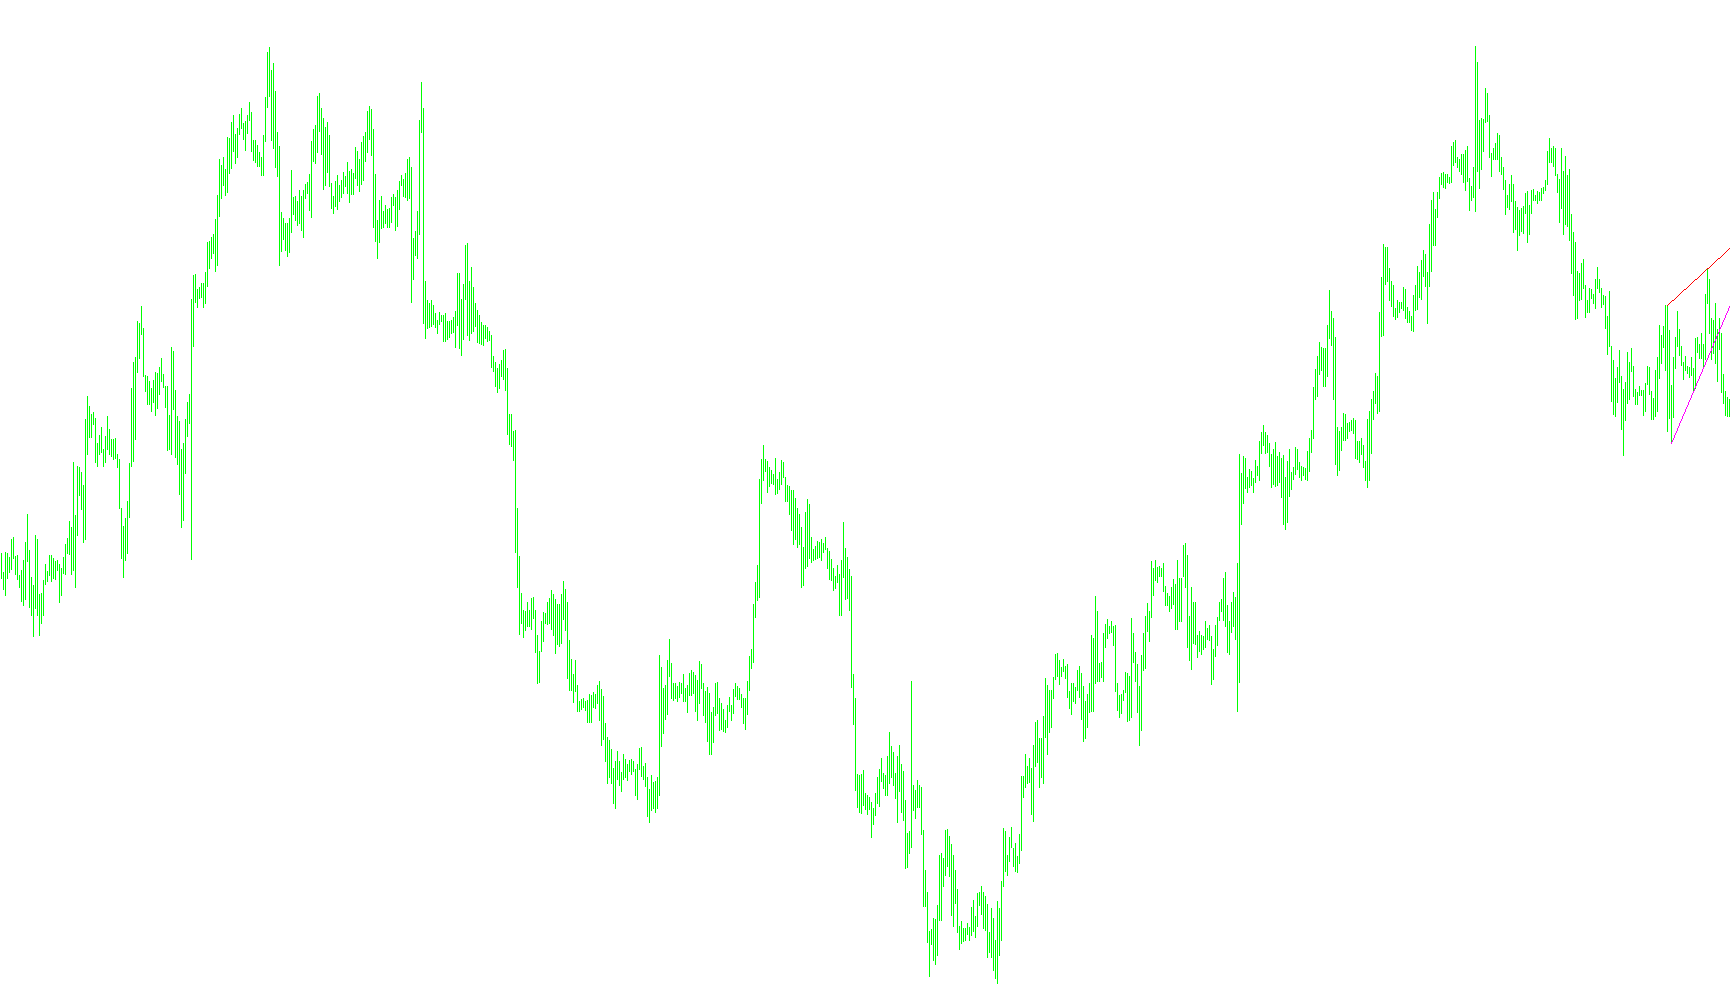
This script is designed to automatically identify and visualize key structural trends on a trading chart by highlighting significant price peaks and valleys. Instead of requiring a trader to manually draw lines to connect historical data, the tool systematically scans recent market history to find these pivotal points for you.
How the Logic Works
1. Historical Data Scanning The script looks back over a specific number of candles (defined by the user) to analyze price movements. It focuses on identifying "extremes"—specifically the highest highs and the lowest lows within set periods. By evaluating these points, the tool can distinguish between minor market noise and significant structural shifts.
2. Identifying Support and Resistance Peaks The core logic works by comparing current price data against historical extremes:
- Support Points: The script identifies local "bottoms" in the price action where the market showed a tendency to stop falling.
- Resistance Points: The script identifies local "tops" in the price action where the market showed a tendency to stop rising.
3. Dynamic Trendline Mapping Once the most relevant peaks and valleys are identified, the script automatically constructs visual trendlines on your chart:
- Downending Trends: It connects identified low points to create a visual representation of descending price action (Support).
- Upending Trends: It connects identified high points to create a visual representation of ascending price action (Resistance).
4. Real-Time Updates The script is dynamic. As new price data appears on the chart, it re-evaluates the most recent "highest" and "lowest" points. This ensures that the primary trendlines move and adjust automatically in real-time to reflect the current market trajectory without needing manual intervention from the user.
Summary for the Trader
Essentially, this tool acts as an automated "trend analyst." It cleans up the chart by highlighting the most significant price boundaries, allowing you to see the overarching direction of the market (upward or downward) more clearly by focusing on the most important historical price anchors.
//+------------------------------------------------------------------+
//|                                                trendlinesDay.mq4 |
//|                      Copyright © 2008, MetaQuotes Software Corp. |
//|                                        http://www.metaquotes.net |
//+------------------------------------------------------------------+
#property copyright "nsi2000"
#property link      "http://www.expert-mt4.nm.ru"
//----
#property indicator_chart_window
//---- input parameters
extern int nPeriod=10;
extern int Limit=350;
///---- int Widners Oscilator
int cnt,nCurBar=0;
//+------------------------------------------------------------------+
//| Custom indicator initialization function                         |
//+------------------------------------------------------------------+
int init()
  {
//---- Output in Char
   for(cnt=0; cnt<=5; cnt++)
     {
      ObjectCreate("WSO-"+cnt,OBJ_HLINE,0,0,0);
      ObjectSet("WSO-"+cnt,OBJPROP_COLOR,Red);
      if(cnt<5)
        {
         ObjectCreate("Trend DN-"+cnt,OBJ_TREND,0,0,0,0,0);
         ObjectSet("Trend DN-"+cnt,OBJPROP_COLOR,Magenta);
        }
      //----
      ObjectCreate("WRO-"+cnt,OBJ_HLINE,0,0,0);
      ObjectSet("WRO-"+cnt,OBJPROP_COLOR,Blue);
      if(cnt<5)
        {
         ObjectCreate("Trend UP-"+cnt,OBJ_TREND,0,0,0,0,0);
         ObjectSet("Trend Up-"+cnt,OBJPROP_COLOR,Aqua);
        }
     }
//----
   return(0);
  }
//+------------------------------------------------------------------+
//| Custor indicator deinitialization function                       |
//+------------------------------------------------------------------+
int deinit()
  {
//---- TODO: add your code here
   for(cnt=0; cnt<=5; cnt++)
     {
      ObjectDelete("Trend UP-"+cnt);
      ObjectDelete("Trend DN-"+cnt);
      ObjectDelete("WSO-"+cnt);
      ObjectDelete("WRO-"+cnt);
     }
//----
   return(0);
  }
//+------------------------------------------------------------------+
//| Custom indicator iteration function                              |
//+------------------------------------------------------------------+
int start()
  {
//---- TODO: add your code here
   double r1,r2,r3,r4,r5,r6;
   int rt1,rt2,rt3,rt4,rt5,rt6;
   double s1,s2,s3,s4,s5,s6;
   int st1,st2,st3,st4,st5,st6;
//---- Ëèíèè ñîïðîòèâëåíèÿ è ïîääåðæêè
   if(Bars<Limit) Limit=Bars-nPeriod;
   for(nCurBar=Limit; nCurBar>0; nCurBar--)
     {
      if(Low[nCurBar+(nPeriod-1)/2]==Low[Lowest(NULL,0,MODE_LOW,nPeriod,nCurBar)])
        {
         s6=s5; s5=s4; s4=s3; s3=s2; s2=s1; s1=Low[nCurBar+(nPeriod-1)/2];
         st6=st5; st5=st4; st4=st3; st3=st2; st2=st1; st1=nCurBar+(nPeriod-1)/2;
        }
      if(High[nCurBar+(nPeriod-1)/2]==High[Highest(NULL,0,MODE_HIGH,nPeriod,nCurBar)])
        {
         r6=r5; r5=r4; r4=r3; r3=r2; r2=r1; r1=High[nCurBar+(nPeriod-1)/2];
         rt6=rt5; rt5=rt4; rt4=rt3; rt3=rt2; rt2=rt1; rt1=nCurBar+(nPeriod-1)/2;
        }
     }
//---- Move Object in Chart

   ObjectMove("Trend DN-0",1,Time[st1],s1);
   ObjectMove("Trend DN-0",0,Time[st2],s2);
//----
   ObjectMove("Trend UP-0",1,Time[rt1],r1);
   ObjectMove("Trend UP-0",0,Time[rt2],r2);
//----
   return(0);
  }
//+------------------------------------------------------------------+
Comments