Trend History
Download script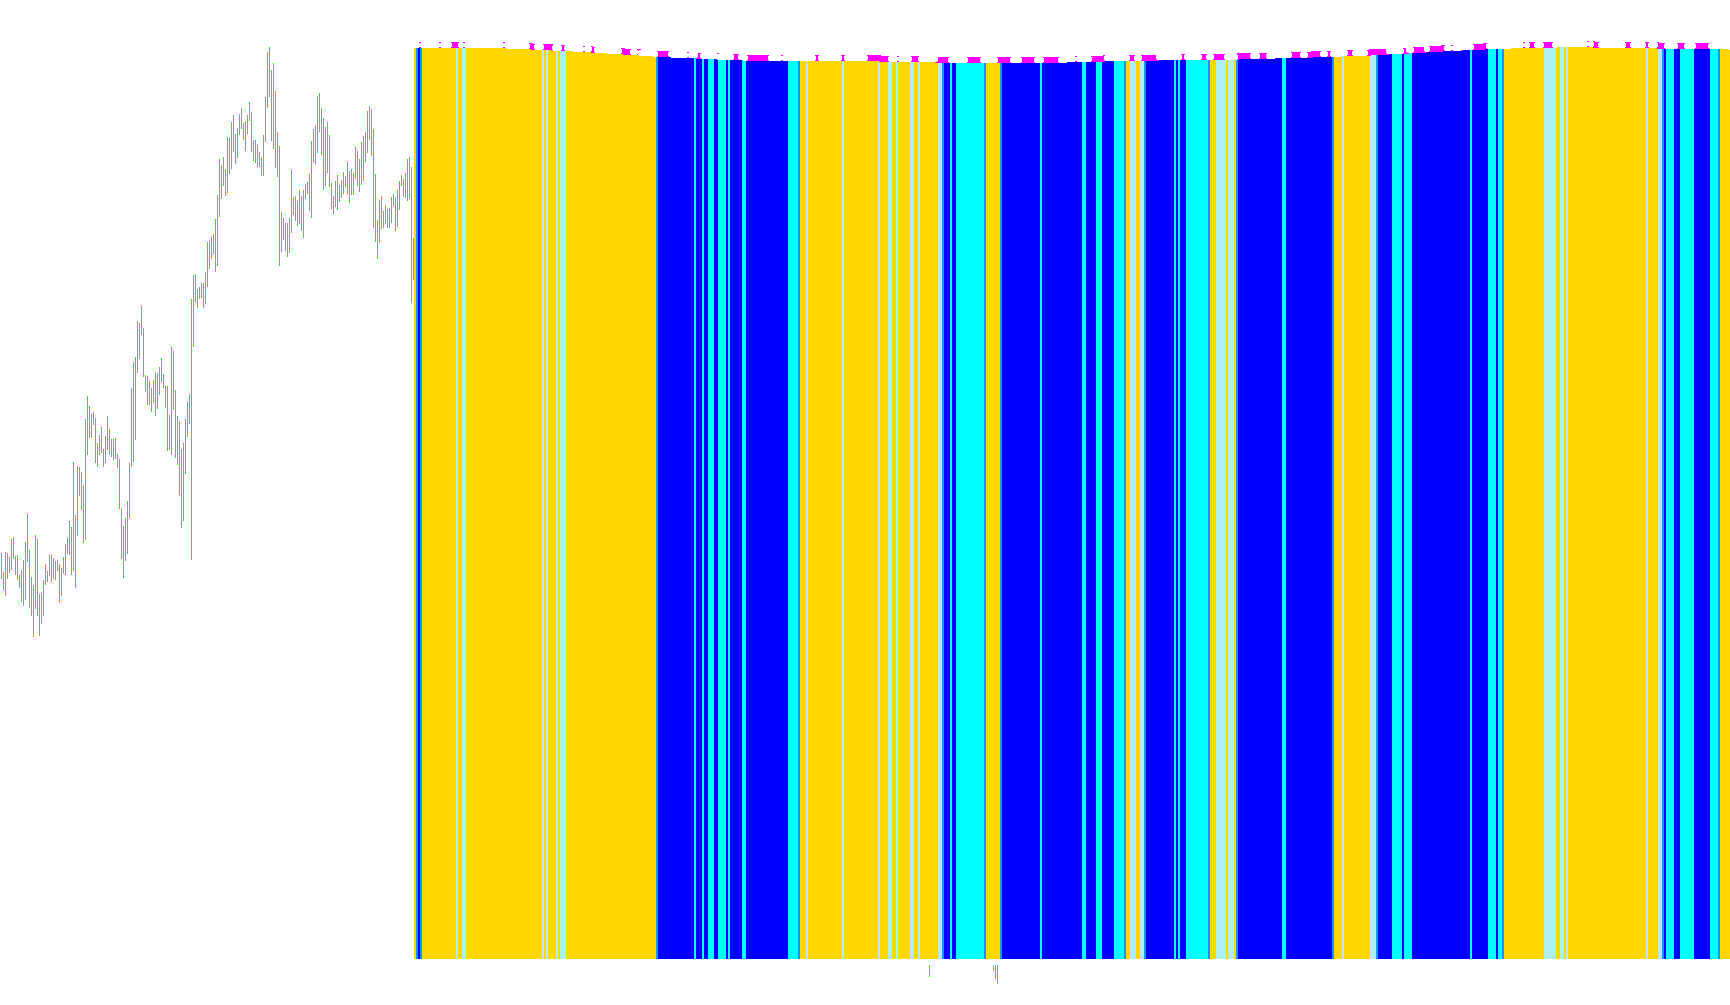
The Trend History indicator is a comprehensive technical analysis tool designed to provide traders with a visual representation of market direction, momentum, and trend stability. Rather than relying on a single metric, it synthesizes data from several advanced moving average models to create a multi-layered "history" of price action.
Core Functional Logic
The script functions by analyzing the relationship between current price movement and various smoothed averages. It breaks down its logic into three primary categories:
1. Trend Direction & Filtering The tool utilizes a series of complex moving averages (including LSMA and StepMA variations) to determine whether the market is in an uptrend or a downtrend.
- Bullish Confirmation: The indicator identifies positive momentum by checking if specific price thresholds are met in relation to smoothed trend lines. When these conditions align, it highlights the primary trend progression.
- Bearish Confirmation: Conversely, it monitors for downward pressure where price action falls below established support levels, marking these segments as negative trends.
2. Momentum and Slope Analysis Beyond just "up or down," the script evaluates the intensity of the trend. It looks at the "slope" of moving averages—essentially measuring how fast or slow a trend is developing. By comparing current slopes to previous periods, it can distinguish between a strong, accelerating move and a weakening, flat market.
3. Dynamic Visual Signaling The indicator translates these complex mathematical calculations into clear visual cues on the chart:
- Histogram Bars: These provide a continuous flow of trend data, allowing traders to see the "history" of the market's strength at a glance.
- Directional Arrows: The script generates specific signals (arrows) based on crossovers and momentum shifts. These act as immediate visual alerts when the market transitions from one state to another or reaches a significant point of reversal.
How it Works for the User
Instead of forcing the trader to interpret multiple overlapping lines, this script processes all that data in the background. It looks at the price, the historical average, and the rate of change simultaneously. It then filters out the "noise" to display only the most significant trend information, helping you identify whether the market is currently trending strongly, consolidating, or preparing for a reversal.
//_Trend History.mq4 _________\¦/
//_http://www.forex-tsd.com__(ò ó)
//______________________o0o___(_)___o0o__
//___¦_____¦_____¦_____¦_____¦_____¦_____¦
//¦_____¦_____¦_____¦_____¦_____¦_____¦__
//___¦_____¦_____¦_____¦_____¦_____¦_____¦
//¦_____¦_____¦_____¦_____¦_____¦_____¦__
#property copyright "Baba_master"
#property indicator_separate_window
#property  indicator_buffers 8
#property indicator_color1 Red
#property indicator_color2 Lime
#property indicator_color3 Red
#property indicator_color4 White
#property indicator_color5 Lime
#property indicator_color6 Lime
#property indicator_color7 Red
#property indicator_color8 Tan
double ExtMapBuffer0[];
double ExtMapBuffer1[];
double ExtMapBuffer2[];
double ExtMapBuffer3[];
double ExtMapBuffer4[];
double ExtMapBuffer5[];
double ExtMapBuffer6[];
double ExtMapBuffer7[];
double buf0,buf1,buf2,buf3,buf4,buf5,buf6,buf7;
extern int TF=0;
extern int Lsma_period = 300;
extern int Lsma_slope = 10;
extern int Lenght=10;
extern double KV=1.0;
extern int Mode=0;
extern int jma=5;
int init(){
int ArrSize = 159;
SetIndexBuffer(0,ExtMapBuffer0);
SetIndexBuffer(1,ExtMapBuffer1);
SetIndexBuffer(2,ExtMapBuffer2);
SetIndexBuffer(7,ExtMapBuffer3);
SetIndexBuffer(3,ExtMapBuffer4);
SetIndexBuffer(5,ExtMapBuffer5);
SetIndexBuffer(6,ExtMapBuffer6);
SetIndexBuffer(4,ExtMapBuffer7);
SetIndexStyle(0,DRAW_HISTOGRAM,STYLE_SOLID,2);
SetIndexStyle(1,DRAW_HISTOGRAM,STYLE_SOLID,2);
SetIndexStyle(2,DRAW_HISTOGRAM,STYLE_SOLID,2);
SetIndexStyle(7,DRAW_ARROW,0,2);
SetIndexStyle(3,DRAW_HISTOGRAM,STYLE_SOLID,2);
SetIndexStyle(5,DRAW_ARROW,0,2);
SetIndexStyle(6,DRAW_ARROW,0,2);
SetIndexStyle(4,DRAW_HISTOGRAM,STYLE_SOLID,2);
SetIndexArrow(7,ArrSize);
SetIndexArrow(5,ArrSize);
SetIndexArrow(6,ArrSize);
IndicatorShortName("Trend_History");
   return(0);}
int start(){
   datetime TimeArray[];
   int i,limit,y=0,counted_bars=IndicatorCounted();
   ArrayCopySeries(TimeArray,MODE_TIME,Symbol(),TF);
   limit=Bars-1;
   for(i=0,y=0;i<limit;i++)
  {while (Time[i]<TimeArray[y]) y++;
  buf0=iCustom(Symbol(),TF,"LSMA in Color3",Lsma_period,0,0,y);
  buf2=iCustom(Symbol(),TF,"StepMA",Lenght,KV,0,Mode,0,0,false,2,0,1,y);
  buf3=iCustom(Symbol(),TF,"StepMA",Lenght,KV,0,Mode,0,0,false,2,0,2,y);
  buf4=iCustom(Symbol(),TF,"StepMA",Lenght,KV,0,Mode,0,0,false,0,0,0,y);
  buf5=iCustom(Symbol(),TF,"LSMA in Color3",Lsma_slope,0,0,y);
  buf6=iCustom(Symbol(),TF,"LSMA in Color3",Lsma_slope,0,0,y+1);
  buf7=iCustom(NULL,TF,"JJMA",jma,0,0,0,0,y);
  if ((buf2>=buf3)&&(buf4>Close[y]))
 {ExtMapBuffer0[i]=buf0;
  ExtMapBuffer1[i]=EMPTY_VALUE;
  ExtMapBuffer2[i]=EMPTY_VALUE;
  ExtMapBuffer7[i]=EMPTY_VALUE;
  ExtMapBuffer4[i]=EMPTY_VALUE;}
  if ((buf2<=buf3)&&(buf4<Close[y]))
 {ExtMapBuffer1[i]=buf0;
  ExtMapBuffer0[i]=EMPTY_VALUE;
  ExtMapBuffer2[i]=EMPTY_VALUE;
  ExtMapBuffer7[i]=EMPTY_VALUE;
  ExtMapBuffer4[i]=EMPTY_VALUE;}
  if((buf3>buf2)&&(buf4>=Close[y]))
 {ExtMapBuffer7[i]=buf0;
  ExtMapBuffer1[i]=EMPTY_VALUE;
  ExtMapBuffer0[i]=EMPTY_VALUE;
  ExtMapBuffer2[i]=EMPTY_VALUE;
  ExtMapBuffer4[i]=EMPTY_VALUE;}
  if((buf3<buf2)&&(buf4<=Close[y]))
 {ExtMapBuffer2[i]=buf0;
  ExtMapBuffer1[i]=EMPTY_VALUE;
  ExtMapBuffer0[i]=EMPTY_VALUE;
  ExtMapBuffer4[i]=EMPTY_VALUE;
  ExtMapBuffer7[i]=EMPTY_VALUE;}
  if((buf3==buf2))
 {ExtMapBuffer4[i]=buf0;
  ExtMapBuffer1[i]=EMPTY_VALUE;
  ExtMapBuffer0[i]=EMPTY_VALUE;
  ExtMapBuffer7[i]=EMPTY_VALUE;
  ExtMapBuffer2[i]=EMPTY_VALUE;}
  ExtMapBuffer3[i]=buf7;
  if((buf5>=buf6))
 {ExtMapBuffer5[i]=buf0;
  ExtMapBuffer6[i]=EMPTY_VALUE;}
  if((buf5<=buf6))
 {ExtMapBuffer6[i]=buf0;
  ExtMapBuffer5[i]=EMPTY_VALUE;}}

   return(0);
  }
//+------------------------------------------------------------------+
Comments