Trend_CF_v2
Download script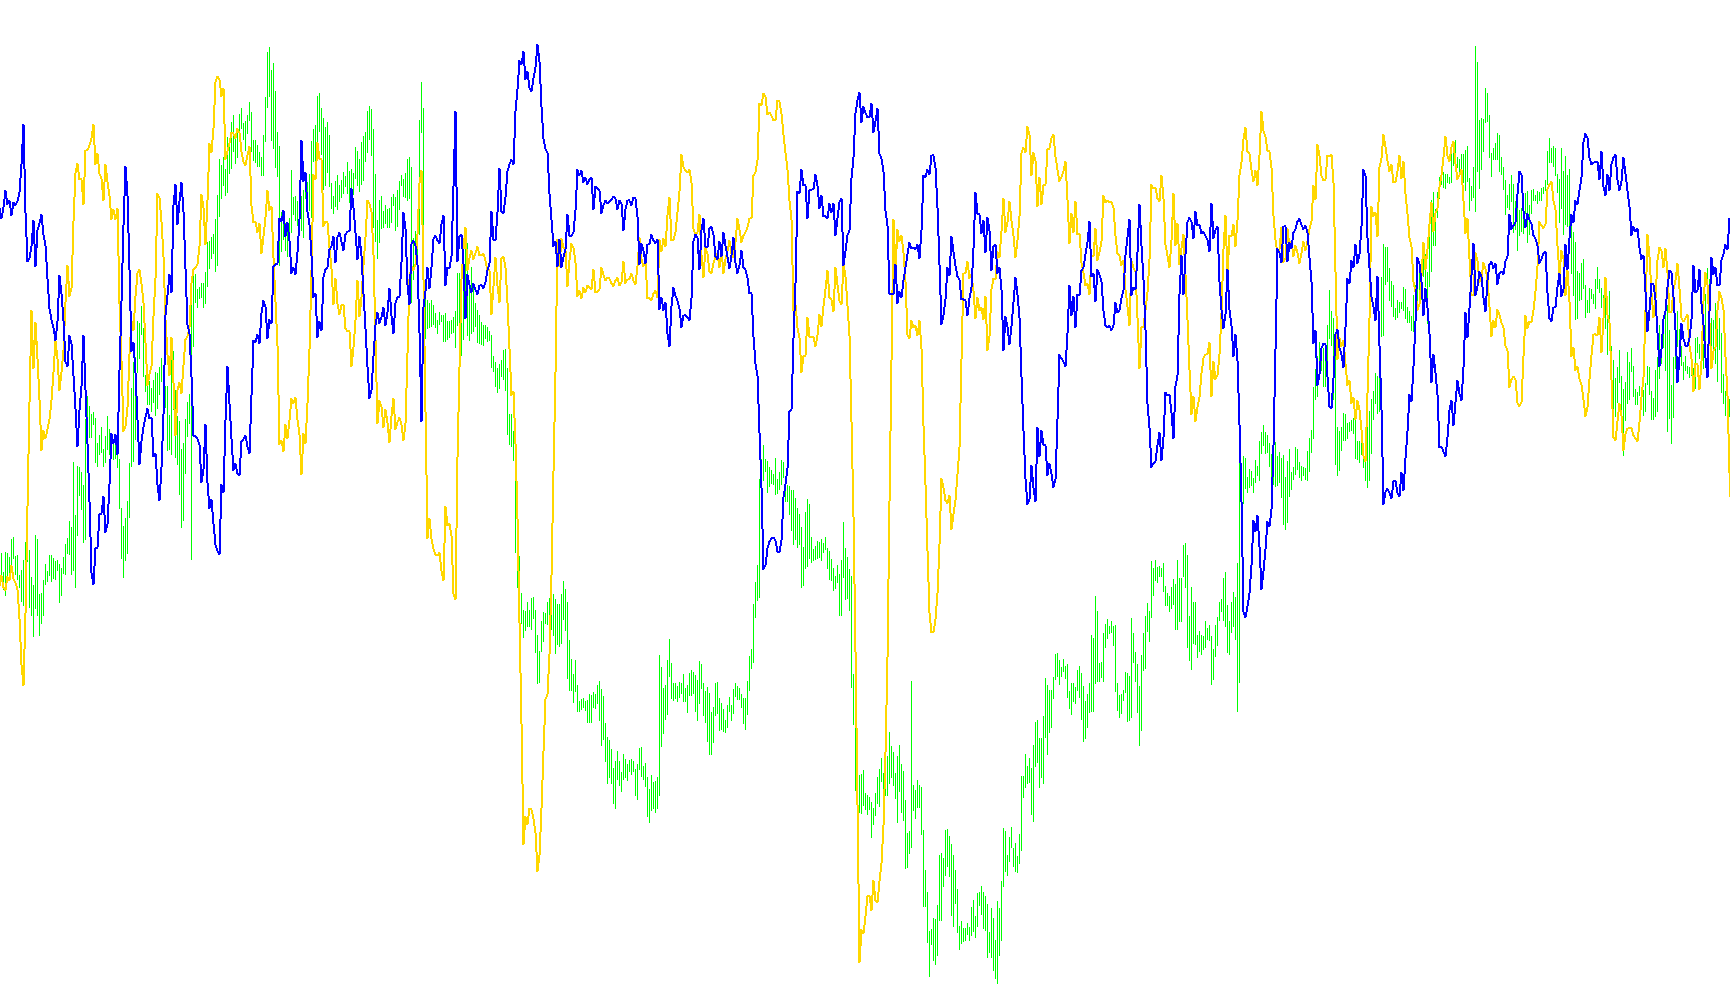
This tool is designed to analyze price movements in the financial markets by identifying and measuring the underlying momentum of a trend. Rather than simply looking at whether the price went up or down, it focuses on the "Continuation Factor"—essentially determining how strongly a current trend is persisting over a specific period of time.
Core Logic Overview
The indicator operates by breaking down every price change into its simplest components: upward movement and downward movement. It treats these two directions independently to see which one is dominating the market's behavior at any given moment.
1. Identifying Directional Movement The script looks at each candle (or bar) on the chart. If the current price is higher than the previous one, it records the distance of that increase as a positive movement. If the price is lower, it records the distance of the decrease as a negative movement.
2. Cumulative Tracking Instead of just looking at single bars in isolation, the logic builds a running history of these movements. It creates a "cumulative" effect where the movement of each new bar is added to the sum of all previous movements. This allows the tool to distinguish between a small, fleeting price flicker and a sustained, significant move in one direction.
3. The Continuation Factor (CF) This is where the unique logic comes into play. To provide a clear picture of the trend, the indicator performs a balancing act:
- It calculates the total sum of movements for a specific look-back period (defined by the user).
- It then subtracts the "opposite" momentum from the current trend. For example, it looks at the strength of the upward moves and subtracts the weight of the downward moves from that same timeframe.
Visual Interpretation
The result is displayed in a separate window on your chart as two distinct lines (Green and Orange). These lines represent the net force of the trend:
- One line tracks the net strength of the positive price movement adjusted by opposing pressure.
- The other line tracks the net strength of the negative price movement adjusted by opposing pressure.
By watching these lines, a trader can see the "momentum" of the market. When one line moves significantly away from the other, it indicates a strong trend is prevailing. When the lines converge or flatten, it suggests that the buying and selling pressures are reaching an equilibrium, potentially signaling a period of consolidation or a shift in market sentiment.
//+------------------------------------------------------------------+
//|                                                     Trend_CF.mq4 |
//|                                         CF = Continuation Factor |
//|               Converted by and Copyright: Ronald Verwer/ROVERCOM |
//|                                                         27/04/06 |
//+------------------------------------------------------------------+
#property indicator_separate_window
#property indicator_buffers 2
#property indicator_color1 Green
#property indicator_color2 Orange
#property indicator_width1 2
#property indicator_width2 2
//----
extern int T3_Period=16;
extern double T3_Continuation_Factor=0.618;
//----
double t1[];
double t2[];
double x_p[];
double x_n[];
double y_p[];
double y_n[];
//+------------------------------------------------------------------+
//| Custom indicator initialization function                         |
//+------------------------------------------------------------------+
int init()
  {
//---- indicators setting
   IndicatorDigits(MarketInfo(Symbol(),MODE_DIGITS)+2);
   IndicatorShortName("T3 TrendCF "+T3_Period);
   IndicatorBuffers(6);
   SetIndexBuffer(0,t1);
   SetIndexBuffer(1,t2);
   SetIndexBuffer(2,x_p);
   SetIndexBuffer(3,x_n);
   SetIndexBuffer(4,y_p);
   SetIndexBuffer(5,y_n);
   SetIndexStyle(0,DRAW_LINE,STYLE_SOLID,2);
   SetIndexStyle(1,DRAW_LINE,STYLE_SOLID,2);
   SetIndexLabel(0,"Trend_CF1 ("+T3_Period+")");
   SetIndexLabel(1,"Trend CF2 ("+T3_Period+")");
//----
   return(0);
  }
//+------------------------------------------------------------------+
//| Custom indicator iteration function                              |
//+------------------------------------------------------------------+
int start()
  {
   int i,q,limit;
   double chp,chn,cffp,cffn;
   int counted_bars=IndicatorCounted();
//---- check for possible errors
   if(counted_bars<0) return(-1);
//---- last counted bar will be recounted
   if(counted_bars>0) counted_bars--;
//----
   limit=Bars-counted_bars;
//---- indicator calculation
   for(i=limit; i>=0; i--)
     {
      if (Close[i]>Close[i+1])
        {
         x_p[i]=Close[i]-Close[i+1];
         y_p[i]=x_p[i]+y_p[i+1];
         x_n[i]=0;
         y_n[i]=0;
        }
      else
        {
         x_n[i]=Close[i+1]-Close[i];
         y_n[i]=x_n[i]+y_n[i+1];
         x_p[i]=0;
         y_p[i]=0;
        }
      chp=0;chn=0;cffp=0;cffn=0;
      for(q=i+T3_Period;q>=i;q--)
        {
         chp=x_p[q]+chp;
         chn=x_n[q]+chn;
         cffp=y_p[q]+cffp;
         cffn=y_n[q]+cffn;
        }
      t1[i]=chp-cffn;
      t2[i]=chn-cffp;
     }
//----
   return(0);
  }
//+------------------------------------------------------------------+
Comments